The Community Food System Indicators are a partnership among OSU Extension, the Center for Small Farms & Community Food Systems and the Oregon Community Food Systems Network.
Updated data on Oregon agriculture — from the 2017 Census of Agriculture — is available on OSU Extension’s Rural Communities Explorer’s Communities Reporter Tool for the state and all counties.
Newly updated indicators include:
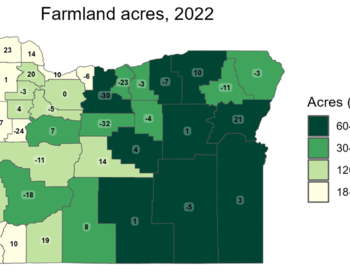
- Number of farms, acres farmed, average value per acre.
- Farms by size, based on annual sales.
- Average age of farmers, new and beginning farmers.
- What types of crops and livestock are being grown.
- Farm employment and compensation.
- Direct market sales, value-added production and organic production.
Access all available Community Food Systems Indicator data: visualize trends, compare regions, and see statewide maps.
Want all of your county’s data at once? This document contains the most recent data and shows change from one prior period.
New to the Community Food System Indicators? Read this short introduction.
Analysis: Oregon trends and highlights from the 2017 Agriculture Census
Want more than the raw data? Read our analyses of Agriculture Census data for Oregon:
- Total farms, total sales, and distribution of farms by size and scale.
- Oregon agricultural business succession planning.
- Who are Oregon’s agricultural producers?
Heads up: Changes to the Agriculture Census
The 2017 Agricultural Census survey asked new and different questions than prior censuses to improve our understanding of the agricultural sector. The downside means it’s harder (or not possible) to make comparisons with 2012 and earlier agricultural census data. Changes include:
More farmers counted as on-farm decision-makers
While prior Agricultural Censuses only gathered demographic data on one principal operator and two other operators, the 2017 Agricultural Census gathered data on up to four producers per farm, all of whom could identify as principal producers. (This change also affected the average age of farmers.)
Beginning farmers and ranchers
Those new questions changed the number of farmers and ranchers with 10 years’ or less experience operating any farm. So we replaced our old BFR indicators with two new indicators:
- Beginning Farmers and Ranchers. This includes non-principal producers, and these beginning farmers and ranchers may be on farms with producers with more experience.
- Farms with Beginning Principal Farmers and Ranchers. These are farms that have at least one principal producer with 10 ten years’ or less experience. A farm with a beginning principal producer may also include producers with more experience.
Value-added products and direct marketing
The new Agricultural Census asked specifically about processed or value-added products produced and sold from a farm’s own agricultural production. Value-added products are also now included in direct sales. In prior years, they were excluded.
This census did not ask about Community Supported Agriculture (CSA) specifically. Instead, CSA sales are included in direct sales.
Crop production
New questions about specific crops affect the “Food Crops” Indicators and may slightly affect the “Farms Harvesting Vegetables, Potatoes, Melons” indicator.
For more information
For questions or more detailed information on how the changes to the 2017 Agricultural Census affect the Indicators, contact Shannon Caplan at Rural Communities Explorer.