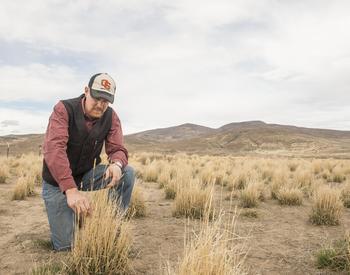
Eastern Oregon’s working landscapes encompass an enormous breadth of diversity across space and through time. While we might collectively refer to eastern Oregon’s rangelands as sage-steppe or Oregon’s outback, these rangeland landscapes are inherently variable due to differences in soils, topography, and climate. Anyone who has ridden through Oregon’s sagebrush country has likely traversed through rocky expanses of low sagebrush with sparse bunchgrasses, ventured down into draws filled with tall basin big sagebrush and towering basin wildrye, and then up into sagebrush stands with sporadic junipers and lush Idaho fescue and bluebunch wheatgrass packed close together underfoot. Cattlemen and land managers know how quickly the landscape can change across relatively short distances, from site to site. Grouping portions of a landscape into “ecological sites” based on similar characteristics allows us to better predict the response of vegetation and related resources to management actions and natural disturbances. Understanding what ecological sites occur on your ranch, and how that might influence their responses to variable water years, especially drought, can aid in better, more effective rangeland management and increase profits.
In this article we will introduce you to a variety of tools and technologies available to help improve rangeland management including:
- Ecological Site Descriptions (ESDs)
- USDA Plants Database
- Fire Effects Information System (FEIS)
- Guide to Northern Great Basin Grasses
- Rangeland Analysis Platform (RAP)
- RAP Production Explorer
We will demonstrate the usefulness of ecological sites, introduce you to online tools that provide production estimates for your property, and describe how to access and use the readily available information. For producers ranching in today’s age of information, online tools and technology could be the ranch hand you didn’t know you needed.
What are ecological sites?
Ecological sites are part of a land classification system that divides landscapes into units for study, evaluation and management.
These sites have short names based on soil type and climate. For example, the ecological site Loamy 10-12 PZ has loamy soils and occurs in the precipitation zone (PZ) that normally annually receives 10–12 inches of rain.
Ecological sites also have an ecological description of their climate, soils and vegetation and an interpretation of those properties relative to management and disturbance history.
Table 1 summarizes information for a ranch with three pastures dominated by different ecological sites: Clayey Playette, Loamy 10–12 PZ and Clayey 10–12 PZ. Find your pasture and instructions at Downloading Ecological Site Descriptions (ESDs) using the Web Soil Survey (WSS). You can also scan the QR code in the table at the end of the article.
Ecological sites as a management tool
Several things determine a site's forage production and health. These include:
- Soil type
- Elevation
- Slope
- Topography
- Plant community
- Water-holding capacity
- Annual herbaceous production
These characteristics should influence your management decisions, particularly if you don't know how the land was managed previously. For example, ecological site descriptions can help you determine if deep-rooted bunchgrasses are not present because of past management (such as overgrazing), disturbances (such as wildfire) or natural reasons (such as a soil type that only supports shallow-rooted grasses).
Table 1 shows that the Clayey Playette ecological site has shallow, finely textured soils typical of dry lake basins and valley floors. It likely will not support a high density of deep-rooted bunchgrasses. The absence of these grasses reflects the site’s low production potential, not mismanagement.
Conversely, the Clayey 10–12PZ ecological site is typical of rolling uplands above 4,500 feet. Its native plant community is dominated by the large, deep-rooted bunchgrasses, bluebunch wheatgrass (Pseudoroegneria spicata ssp. spicata), Thurber’s needlegrass (Achnatherum thurberianum), and Wyoming big sagebrush (Artemisia tridentata ssp. wyomingensis).
While Sandberg’s bluegrass (Poa secunda), a small-statured, shallow-rooted bunchgrass, is common in the stand in this ecological site, we should be concerned if it dominates and there is little to no bluebunch wheatgrass or Thurber’s needlegrass present. A dominance by Sandberg’s in this scenario could indicate lasting impacts from historic disturbances, such as overgrazing.
Download the ecological site description from the website as a .pdf to get the complete species list. The common grasses, forbs and shrubs on each site are usually listed under the additional community tables. These lists will tell you if certain plants are missing due to past management, drought or other factors.
Knowing which species to expect will help determine which species to seed post-fire. For example, seeding a species such as Idaho fescue (Festuca idahoensis) into a site where Thurber’s needlegrass is expected to dominate would likely result in low restoration success.
Knowing the expected species and their potential can help you identify problems. For example, cattle often select more nutritious and palatable species. Their preference changes throughout the year. A pasture where grazing pressure seems in balance with the palatable grass supply could instead be transitioning to less nutritious grass, leading to the loss of the palatable species.
Ecological site descriptions can reveal this. If your pasture's description suggests the dominance of Idaho fescue and you only see bluebunch or crested wheatgrass (Agropyron cristatum), the Idaho fescue may have been overgrazed in previous seasons. This occurs in rangelands grazed in the dormant season when the fescue more readily greens up in the fall than the bluebunch.
Species-specific resources
The ecological site description lists the common name, scientific name, symbol, expected annual production, and sometimes the estimated foliar cover of common species expected on a site. If you are unfamiliar with the species in the site description, consult the following:
For the U.S. Department of Agriculture plants database, enter the common or scientific name of a species of interest into the search bar. The database may present you with multiple options if there are multiple subspecies of the plant selected. Subspecies refer to populations of the same species that differ in physical characteristics or geographic range.
For example, if you type in "bluebunch wheatgrass," you will see information choices for the entire species: Pseudoroegneria spicata or a common subspecies, Pseudoroegneria spicata ssp. spicata. You can then select different information tabs, including other names or synonyms, characteristics and a species range map by state for the U.S.
OSU Extension’s Year-round Field Identification of Common Northern Great Basin Grasses provides helpful photos, descriptions and key identifying information for several common grasses. This publication can be found online if you scan the QR code at the bottom of the article.
The Fire Effects Information System is easy to use. Type in a species of interest, such as one in the ecological site description, and click the link for species reviews. These are highlighted in orange in the figure above. The fire effects system has information on vegetation palatability, nutritional benefits, cover value, disturbed-site restoration merit and fire ecology. The fire effects system is based on scientific research and is peer-reviewed.
Forage forecasting
Ecological site descriptions are a great starting point for better understanding the plant communities throughout your pastures. They include estimates for forage production for the site and by species in low, moderate or high years. These are broad estimates averaged across different sites and many years.
For a more specific, current forage estimate, use the Rangeland Analysis Platform’s (aka “the RAP”) Production Explorer Tool. This tool allows you to compare the current year’s production to past years, plots that number in relation to long-term averages, and even provides an estimate of the stocking rate.
Users can draw an area of interest on a map or upload a shape file.
- Select the import method (that is, the “draw a feature”), orient yourself on the map, click the square button and use your computer mouse to draw a box around your ranch or pasture.
- Click the "calculate time-series" button and select the current year production tab for a graph like the one pictured here. The gray dashed line represents the long-term averages. The thick black line highlights the current year's trajectory.
As of April 6, 2022, production was well below average for this location, overlapping with the dashed red and yellow lines representing 50% and 75% of the long-term averages. The red and yellow lines estimate values for the coming months. The stocking rate tab calculates the estimated stocking rate for the acreage highlighted under a variety of scenarios.
The tool also provides a time series graph that tallies the number of animals this tool would have suggested with the same inputs for previous years. Producers can use the time series to compare to their past use to help “gut-check” the values estimated for the given year.
Conclusion
When looking across ranges, pastures, or forests, portions of the landscape differ in the vegetation each supports. Scientists grouped this variation into ecological sites based on soils, climatic features, physiographic features, and potential native plant communities. Every ecological site — including every pasture on your ranch — has a rich description to inform past, current and future management. These descriptions are a good starting point for understanding your land.
The U.S. Department of Agriculture plants database and the U.S Forest Service fire effects system provide scientifically backed sources and summaries for specific species listed in the ecological site descriptions, including palatability, nutritional value, range maps and response to fire. The new Production Explorer tool allows producers to understand and estimate current and future production in specific pastures relative to long-term averages.
Effective rangeland management proves difficult in the best of years and can be exceedingly challenging when producers are faced with challenges from past management, disturbances like wildfire or extreme drought. Fortunately, in today’s information age several online tools and resources described in this article and listed in the table below with QR codes and website links, can potentially act as an extra “ranch hand” and allow you to make more informed decisions.