Contents
- Introduction
- Site preparation
- Seedling establishment and early rotation
- Mid-rotation
- Late rotation
- Postharvest
- Examples
- Appendix 1. Methods of nutrient application
- Appendix 2. Nutrient sources
- Appendix 3. Frequently asked questions
- Appendix 4. Nutrients in Christmas trees
- Appendix 5. Needle nutrient concentration and whorl position
- Summary and quick reference
- For more information
Introduction
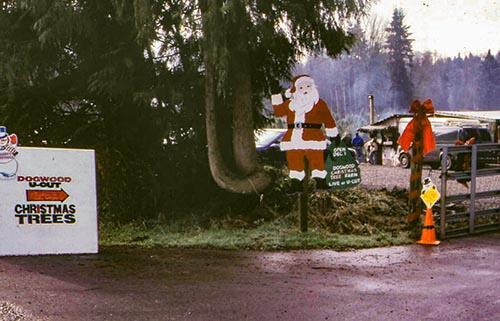
During the past 50 years, plantation Christmas tree production has grown in acreage and sophistication. Nitrogen applications with a tuna can have been replaced by precise, mechanized application of a wide array of nutrients and lime.
Current nutrient management programs must focus on three concepts for success.
- Is the management practice biologically sensible? Is it likely that fertilizing these trees at this time and with this product will produce a significant improvement in tree color, growth or health?
- Is the management practice economically efficient? Can I afford it based on expected results?
- Is the management practice environmentally responsible? Does it produce little or no potential negative impact on soil, water, or air quality?
When the answer to all three questions is “yes,” nutrient management practices should be used to increase Christmas tree quality and profitability.
To understand and influence plant nutritional health and performance, you need a broad knowledge of several important topics, including:
- How conifers grow
- The nutrients necessary for optimal growth
- How to assess the nutrient status of soil and plant foliage
- How to formulate a strategy for nutrient management during the rotation
These topics form the basis for this publication. This guide provides more than fertilizer and lime recommendations; you also will learn to assess a plantation’s nutritional needs based on soil and foliar analyses and rotational timing. These tools will help you design strategies for effective nutrient applications and produce high-quality trees with minimal negative environmental impact.
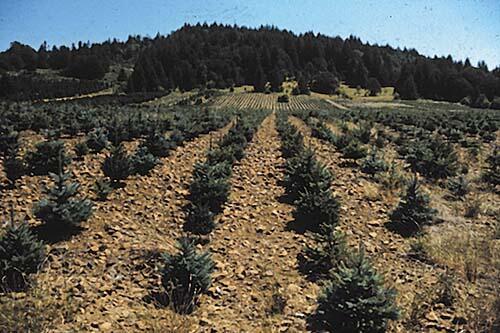
The recommendations included here are appropriate for Christmas tree growers in the foothills of the Coast and Cascade ranges of western Oregon and Washington. In these regions, Christmas trees typically are grown on well-drained clay loam soils at 500 to 1,500 feet elevation. Common soil series include Salkum, Prather, Cinnebar, Olympic and Melbourne in Washington, and Laurelwood, Aloha, Bellpine, Goble, Cornelius, Chehalem, Cazadero, Bornstedt, Alspaugh, Honeygrove and Jory in Oregon (Figure 1). Many of these soils are forest-derived soils that were cleared for agricultural production during European settlement and are well-suited for Christmas tree production.
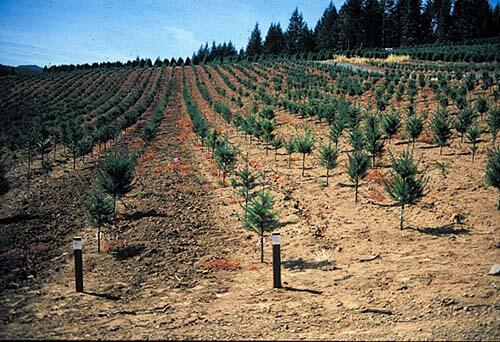
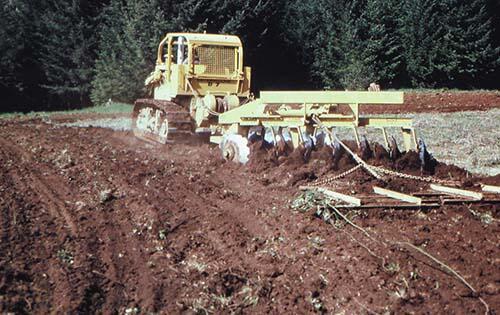
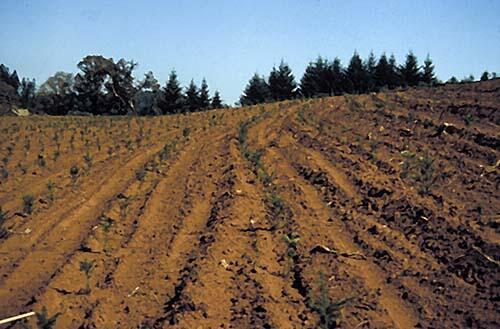
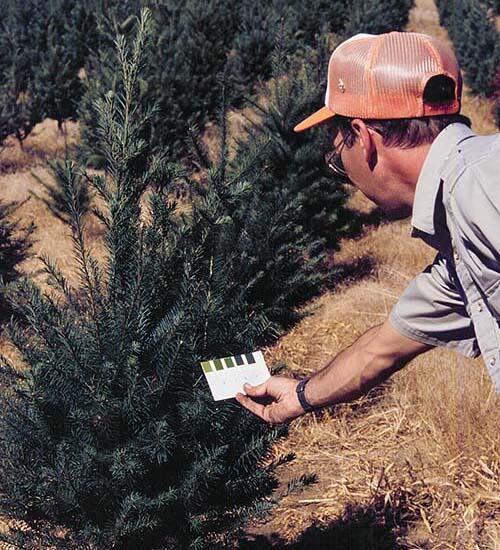
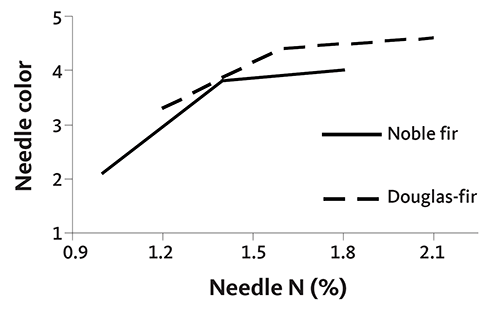
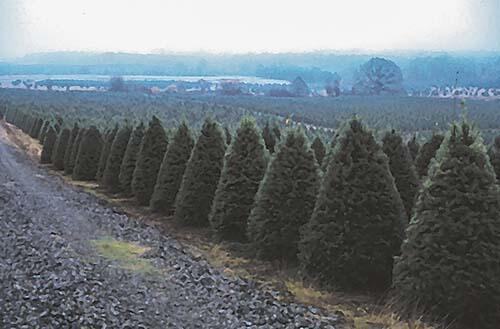
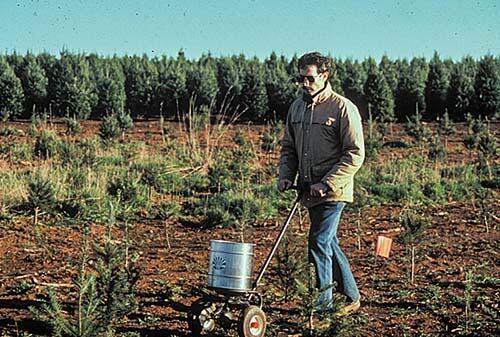
The region’s widely planted Christmas tree species, Douglas-fir and noble fir, are our primary focus. We assume that trees are intensively cultured and that planted seedlings are genetically suitable for Christmas tree production. Fertilization will not compensate for other growth-limiting problems such as soil compaction, poor drainage, pest infestations, weather-related stress, or poor tree planting stock selection (Figure 2).
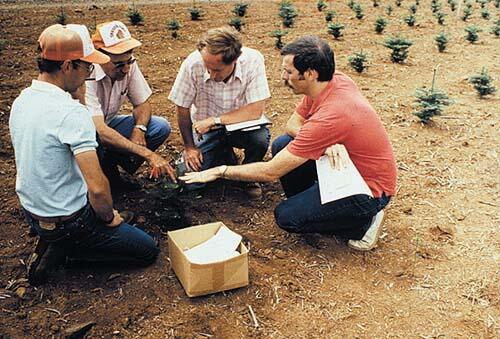
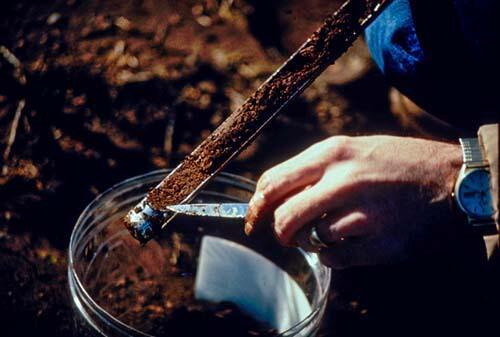
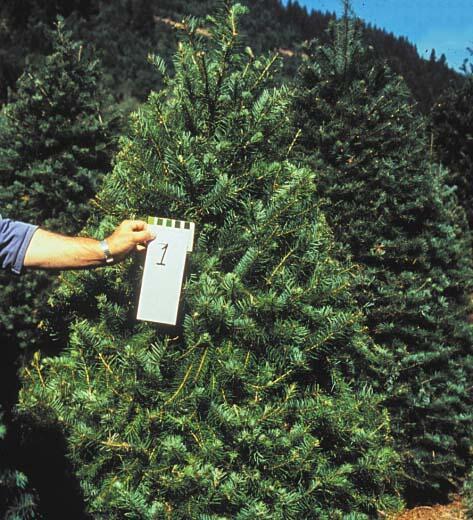
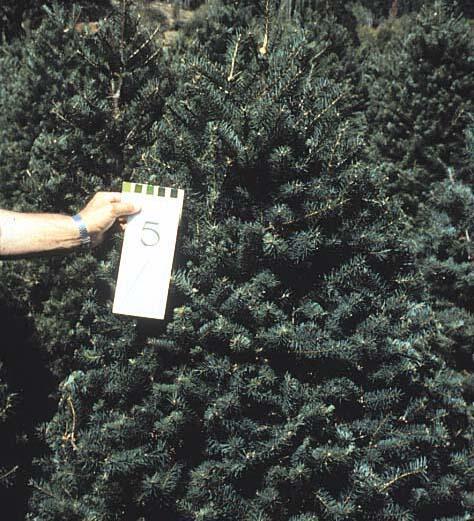
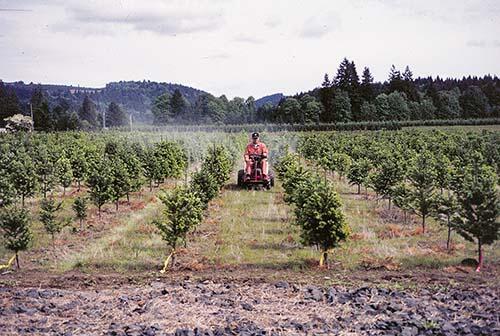
Field research from Oregon and Washington (1987–2009), research from other areas and other crops, and grower observations are the basis for guidelines presented here (Figure 3). See "Research projects" for a description of the research basis of this guide.
This publication is a guide, not a prescription. Use it to formulate recommendations that make sense based on your management style, economics, and site conditions. Consultation with a nutrient management professional may aid in decision making.
Conifer growth
Trees take moisture and nutrients from the soil and air and move them to the foliage, where they are combined with energy from the sun to produce compounds necessary for survival and growth. In addition to supplying nutrients and water, soil contains organic matter and many species of flora and fauna vital to productive tree growth.
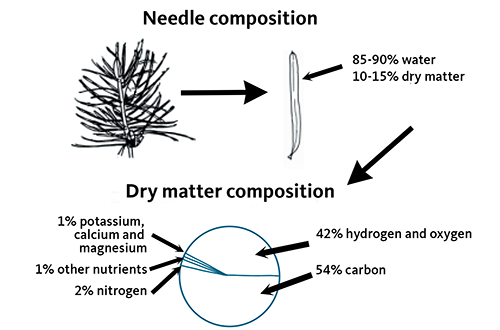
Plants require 16 elements for growth. Carbon (C), hydrogen (H) and oxygen (O) are obtained from air and water. The remaining 13 elements — nitrogen (N), phosphorus (P), potassium (K), calcium (Ca), magnesium (Mg), sulfur (S), boron (B), copper (Cu), chlorine (Cl), manganese (Mn), molybdenum (Mo), iron (Fe) and zinc (Zn) — are primarily supplied by the soil. The key to economical Christmas tree nutrient supply or fertilization is applying only the nutrients not adequately supplied by soil.
Christmas tree growers need to consider when to apply nutrients each year (annual timing) as well as when to apply nutrients during tree production (rotational timing). Christmas tree nutrient use is not the only consideration for timing of fertilizer or lime application. The behavior or mobility of nutrients in the soil determines application timing. For example, N is mobile in the soil and can be added to the soil surface and moved to roots with rain. It can be applied after trees are planted. Conversely, K is not mobile and should be incorporated before planting so roots can use the nutrient.
Nutrient mobility in soil does not mean the nutrient is also mobile in a plant. Table 1 contrasts nutrient mobility in soil and plants. Nutrients that are mobile in plants will exhibit deficiency symptoms in old growth first. Non-mobile plant nutrients show deficiency symptoms first on new growth.
|
Nutrient |
Relative soil mobilitya |
Mobility in plants |
|---|---|---|
| Nitrogen (N) | 1 | Mobile |
| Phosphorus (P) | 5 | Mobile |
| Potassium (K) | 4 | Mobile |
| Sulfur (S) | 3 | Not mobile |
| Calcium (Ca) | 5 | Not mobile |
| Magnesium (Mg) | 5 | Mobile |
| Boron (B) | 2 | Not mobile |
| Copper (Cu) | 5 | Not mobile |
| Chlorine (Cl) | 1 | Not mobile |
| Iron (Fe) | 5 | Not mobile |
| Manganese (Mn) | 5 | Not mobile |
| Zinc (Zn) | 5 | Not mobile |
a1 = highest mobility (easily moved with water)
5 = immobile (does not move)
Seasonal and developmental changes influencing nutrient management
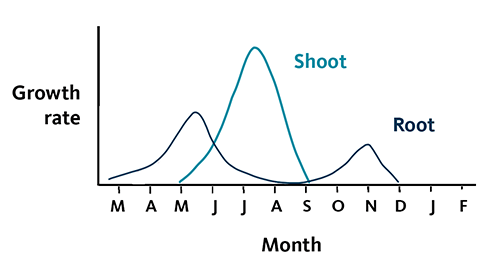
Christmas tree growth follows an annual cycle. Understanding this growth pattern helps ensure that fertilizer applications are timed properly. Proper timing of nutrient application promotes desired growth and improved color, while minimizing excessive growth and environmental risk. Figure 4 shows a typical pattern of Christmas tree root and shoot growth in western Oregon and western Washington.
When root growth begins in February or March, trees benefit from fertilization with mobile elements, such as N, S and B. These nutrients move easily in the soil to Christmas tree roots, which take them into the plant.
Spring bud break occurs during April or May, depending on the tree species and weather conditions. Appearance of new foliage is the most prominent feature of bud break. This event marks the beginning of the trees’ annual maximum nutrient need. Shoots and roots are growing simultaneously. The trees must be able to draw from a full complement of nutrients in the soil as growth progresses.
Be especially careful when applying any material shortly after bud break. New needles lack the waxy cuticle layer that protects older needles. Thus, they are susceptible to damage from corrosive or salty materials such as fertilizers and oil-based surfactants applied directly to the needles.
During late summer, conifers stop producing new foliage and set buds for the next growing season. Although food storage and wood production continue into the fall, few nutrients move through the aboveground part of the tree during this time.
A minor root growth spurt accompanies fall rains. As soil and air temperatures decrease with the onset of the rainy season, trees begin to enter dormancy and reach maximum dormancy in the winter.
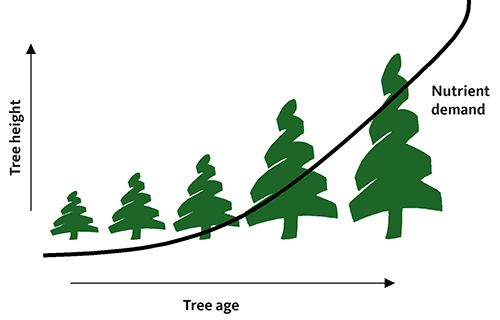
Tree growth removes nutrients from the soil. As conifers grow, the amount of nutrients stored above ground in wood and foliage almost doubles each year. Approximately 50% to 60% of the nutrients are in the needles, 25% in branches and 15% in roots and trunk. Figure 5 shows the nutrient content of a typical conifer needle. As needles senesce, some nutrients move into the tree branches, buds and new needles. The remaining nutrients are carried with the needle as it falls to the ground, creating a “duff” layer.
Soil testing and tissue analysis principles
Soil testing and tissue analysis have the same goal — to determine amounts of nutrients — but they follow quite different procedures and are used for different purposes.
Soil analysis measures the amount of nutrients available to plants. Not all of the nutrients in soil are available; therefore, laboratories use extracts to estimate the amount of each nutrient that will be available to plants during the growing season. Soil test results provide the information needed to make decisions about nutrient and lime additions before planting.
See Monitoring soil nutrients using a management unit approach (PNW 570) for information about sampling soils.
Tissue analysis measures nutrients in needles or other plant parts. The needles are ground and dissolved in a solution, which is then analyzed.
Tissue analysis is the primary tool for nutrient management at the mid-rotation stage. It indicates which nutrients are accumulated in adequate, deficient or excessive amounts. Detection of declining foliar nutrient levels allows fertilizer to be applied before nutrient deficiencies impair tree growth, quality or both.
Rotational timing and nutrient assessment
Nutrient management for Christmas trees can be divided into five stages: site preparation (Figure 6), seedling establishment–early rotation (trees generally are less than 3 feet tall), mid-rotation, late rotation (trees are nearing harvest) and postharvest. Table 2 summarizes monitoring and field activities based on plantation age and height. Nutrient management for each of these stages is discussed later in this publication.
|
Plantation age or tree height |
Monitoring activity |
Season |
Field operation |
|---|---|---|---|
| Site preparation | Soil sampling for Ca, Mg, K, P, pH and SMP lime requirement | Spring before tillage | Incorporate Ca, Mg, K, P and liming materials into soil as needed. |
| Seedling establishment early rotation (tree height less than 3 feet) | None needed unless observation indicates potential problems | — | Apply fertilizer to individual trees if indicated by soil or foliar testing. |
| Mid-rotation (tree height greater than 3 feet) | Single baseline foliar sampling for N, P, K, Ca, Mg, S, B and Mn. Annual foliar sampling for N (and other elements if values are marginal) | January or February | Apply needed fertilizers as indicated by test results and recommendations in this guide. |
| Late rotation | — | — | — |
| Postharvest | — | — | — |
Site preparation
Soils on which Christmas trees commonly are grown in western Oregon and western Washington can supply most nutrients in sufficient quantities for a rotation of Christmas trees. Rather than assuming nutrients are needed, always use soil analysis as the basis for preplant fertilization decisions (Figure 7). A soil test is an inventory of the soil’s capacity to provide nutrients for tree growth.
Soil analysis is recommended prior to planting every rotation. Test results can help you provide adequate nutrients for an entire rotation. Fertilizer recommendations based on soil tests are expected to provide nutrients needed to produce growth, possibly a darker color, and an economic return. The rates recommended in this guide may not increase soil test values.
Sample and test soil before site preparation. Test pH, phosphorus (P), potassium (K), calcium (Ca), magnesium (Mg) and SMP buffer test for lime.
Many laboratories report cation exchange capacity (CEC), percent saturation of some nutrients, hydrogen (H), sodium (Na) and organic matter. The CEC and H are usually estimated from other measurements, and the percent saturation of K, Ca, and Mg is calculated from the estimates. These estimations and calculations are not needed to make a fertilizer recommendation for Christmas trees. The amount of sodium in western Oregon and Washington soils is usually low and is not used for making a fertilizer recommendation.
Soil organic matter is an important soil component that frequently is measured. However, the amount of organic matter in the soil is not easily changed, and reported values are not used for routine nutrient recommendations. If soil organic matter is low compared to other fields in your area, carefully evaluate the site’s suitability for Christmas tree production.
Table 3 gives conversions for units commonly used to report soil test results.
|
To convert column 1 into column 2, divide by |
Column 1 |
Column 2 |
To convert column 2 into column 1, multiply by |
|---|---|---|---|
| 390 | ppm K | meq K/100 g soil | 390 |
| 200 | ppm Ca | meq Ca/100 g soil | 200 |
| 121 | ppm Mg | meq Mg/100 g soil | 121 |
| 230 | ppm Na | meq Na/100 g soil | 230 |
| 1 | meq/100 g soil | cmol/kg soil | 1 |
| 2a | lb/acre (7-inch depth) | ppm | 2a |
| 3.65a | lb/acre (1-foot depth) | ppm | 3.65a |
| 43.56 | lb/acre | lb/1,000 sq ft | 43.56 |
| 43,560 | sq ft | acres | 43,560 |
| 2.471 | acres | hectares | 2.471 |
aThese values vary with soil bulk density.
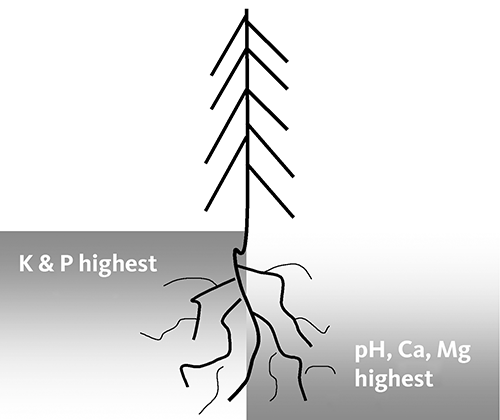
P, K, Ca and Mg do not move rapidly in the soil, so apply and incorporate them during site preparation. Typically, these nutrients move only an inch in the first year after application and even less in subsequent years. Figure 8 illustrates some differences in nutrient concentration with soil depth.
Correcting deficiencies of nonmobile nutrients is difficult in perennial crops such as Christmas trees and is not recommended during a rotation. Amending soils to correct P, K, Ca or Mg deficiencies will not affect foliar concentrations for at least one year after fertilizer is applied.
Phosphorus
Although soils in western Oregon and Washington are naturally low in plant-available P, deficiencies severe enough to reduce Christmas tree growth or quality are not common. Occasionally, P soil test levels of less than 2 parts per million have been observed without visibly limiting growth, reducing tree quality or causing inadequate levels of foliar P.
Adequate needle P concentration in the presence of extremely low soil test P indicates that another factor controls P availability to Christmas trees. Beneficial fungal root infections known as mycorrhizae are likely to be this factor. The fungi extend the tree’s root area thousands of times and increase the roots’ ability to extract P and water from the soil. The tree, in turn, provides the fungi with food (sugars). Both the tree and the fungi benefit. Trees, to a greater extent than many plants, rely on mycorrhizal associations to extract P from soil.
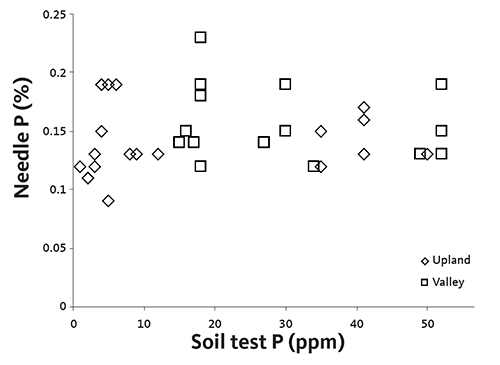
A lack of correlation between needle P concentration and soil test P was seen in data collected from 1988 to 1993 (Figure 9). About half of the needle P levels shown in Figure 9 are marginal (0.08% to 0.15%). Low needle P concentration was universal for both valley and upland soils regardless of soil test P concentration.
P fertilizer decisions
As a precaution, growers are advised to apply P when soil test P is below 15 parts per million, even though reduced growth or tree quality cannot be predicted for lower soil test levels (see Table 4).
Remember, correcting P deficiencies after plantation establishment is difficult because P moves less than 1⁄4 inch per year in the soil. Therefore, applying and incorporating P before planting is critically important.
|
P test value (ppm) |
Rate (lb P2O5/acre) |
|---|---|
| 0–10 | 180 |
| 11–15 | 90 |
| above 15 | 0 (monitor foliar P) |
aRecommendations are based on the Bray method. Recommendations are designed for a soil sample from the soil surface to a depth of 6 or 8 inches.
Potassium
Potassium-containing minerals are present in parent material of most Pacific Northwest soils. In general, this native K supply is adequate to meet Christmas tree need, making K fertilization unnecessary. However, past farming practices and tree removal deplete the soil K supply. For example, 75–150 pounds of K per acre is removed with tree harvest.
K fertilizer decisions
Check soil test K levels prior to planting to determine whether K supplies are adequate. When soil test K is below 75 parts per million, apply K as recommended in Table 5.
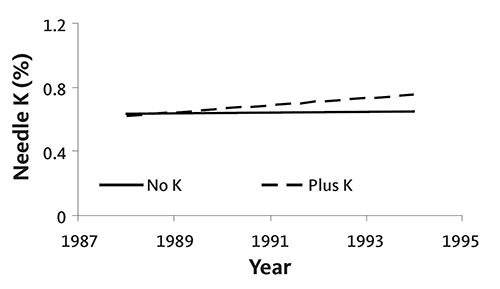
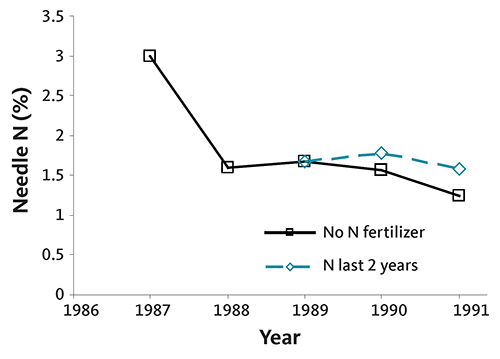
Research has shown that application of K will increase needle K concentration when soil test K is between 75 and 125 parts per million (Figure 10). Despite this increase in needle K concentration, however, tree growth and quality did not change following K application. Thus, K application is not recommended when soil test K is above 75 parts per million.
Potassium is not mobile in the soil, so it should be incorporated prior to planting. Figure 10 shows that continued topdressing of K will change needle K. However, top-dressed material probably will not be available until a year after application, and repeated application may be necessary to change needle K concentration. Incorporation is a more efficient method of supplying K. Incorporated K is immediately available to roots.
|
K test value (ppm) |
Rate (lb K2O/acre) |
|---|---|
| below 75 | 100–200 |
| above 75 | 0 (monitor foliar K) |
Soil acidity, pH and liming
Soils in western Oregon and Washington are naturally acidic, with a pH between 5.0 and 6.5. Christmas trees are well suited to these moderately acidic soils. The recommended pH range for conifers is 5.0 to 5.6; therefore, soil management for Christmas tree production should not allow pH to drop below 5.0.
As soil pH declines from 6.0, solubility of Mn and aluminum (Al) increases, especially when pH is below 5.0. These elements can reach levels toxic to plants and inhibit root growth. The increase in Christmas tree needle Al and Mn with decreasing soil pH is shown in Figure 11.
For additional information about needle Mn and soil pH, see "N fertilizer, soil pH and increasing needle manganese."
Soil pH can drop during a rotation, particularly if you add acidifying N fertilizers. Most N sources for Christmas tree production, including urea, contain the ammonium (NH4+) form of N. Ammonium-N is converted to nitrate-N (NO3-) by soil microbes. This process releases hydrogen (H+) ions and acidifies soil.
Even if soil pH is adequate for Christmas tree production at the start of a rotation, it may decrease 1 pH unit during the rotation if high rates of N are applied annually. For example, if the soil pH is 5.2 at the beginning of the rotation, it easily could fall below 5.0 during the rotation.
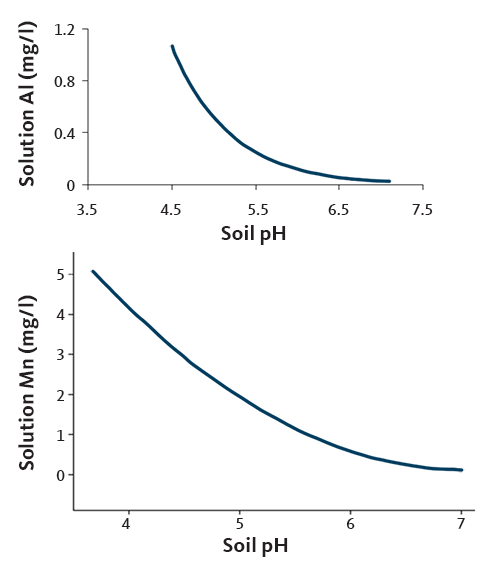
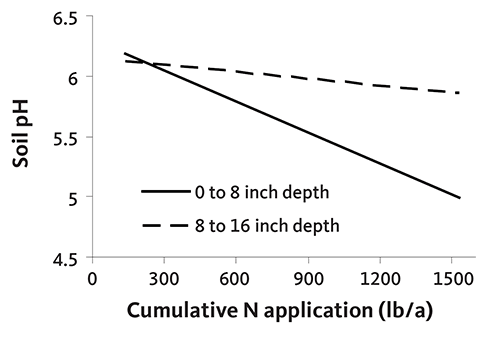
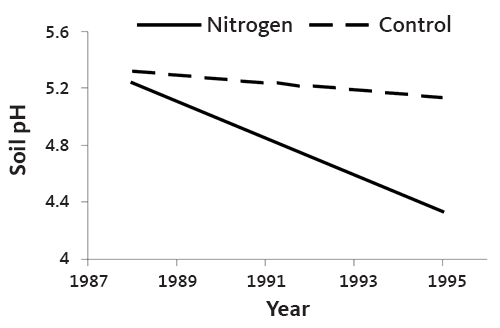
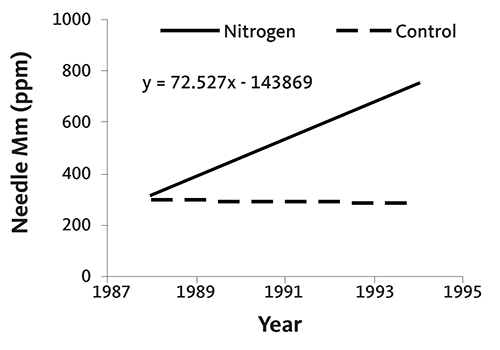
Figure 12 illustrates decreasing soil pH in response to addition of N fertilizer in a Christmas tree plantation. Soil pH declined about 0.1 unit in the top 8 inches of soil for every 100 pounds of N used. This rate of pH decline is consistent with that measured in other western Oregon cropping systems. Soil pH changed little below a depth of 8 inches. Figure 13 shows the decrease in soil pH over the course of a rotation in an N-fertilized plantation.
The N application rates in Figures 12 and 13 are higher than would be expected for commercial Christmas tree production. Even so, the trend is the same with typical N fertilizer rates.
Choose-and-cut or “U-cut” growers should consider use of nonacidifying N sources such as calcium nitrate. For more information on use of calcium nitrate, see "Appendix 2. Nutrient sources."
Liming decisions
Lime increases soil pH, thus reducing problems associated with soil acidity, and it also supplies Ca, Mg or both. Lime moves slowly in soil, so it must be applied and incorporated during site preparation to be effective.
Two laboratory measurements are used to make a lime recommendation — soil pH and SMP buffer lime requirement (LR). Soil pH determines whether a soil needs lime, but it does not indicate how much lime is needed. Lime recommendations (Table 6) are based on the SMP buffer.
The anticipated rate of soil pH decline can be used to decide whether lime should be added at the beginning of a rotation. If you think the soil pH may drop below 5.0 during the rotation, apply and incorporate lime before planting. For example, if you expect to apply 500 pounds of N during a rotation, the soil pH can be expected to decline about 0.5 unit. In this case, if soil pH is 5.5 or above, lime may not be necessary before planting. If you till the field only every other rotation, ensure that soil pH will be sufficient for two rotations.
|
SMP buffer |
Lime needed to raise pH of surface 6 inches of soil to 5.6 (ton/acre)a |
|---|---|
| 4.8–5.0 | 5–6 |
| 5.1–5.3 | 4–5 |
| 5.4–5.6 | 3–4 |
| 5.7–5.9 | 2–3 |
| 6.0–6.2 | 1–2 |
| above 6.2 | 0 |
aLime recommendation is based on 100-score lime. Lime score represents the effectiveness of the liming reaction, regardless of lime source. See Appendix 2 for an explanation of lime score and liming materials.
Two primary types of lime are available: agricultural (calcitic) lime and dolomitic lime. Calcium carbonate predominates in agricultural lime, while dolomitic lime consists of both Ca and Mg carbonates. Agricultural lime normally is preferred unless soils also are low in Mg. See “Magnesium” to determine whether you should use dolomitic lime to supply Mg. By-product lime also is available. "Appendix 2” details lime sources.
Calcium
Calcium deficiencies are extremely rare when soil pH is above 5.0 and are rarely seen in Christmas tree production.
Soil Ca tends to decline with multiple crops of Christmas trees. In a 2001–2002 survey, Ca soil test values were lower in late-rotation fields than in first-rotation fields. Nonetheless, soil Ca was well above levels required for good tree growth even in late-rotation fields.
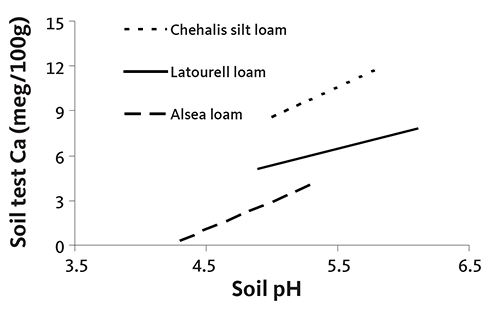
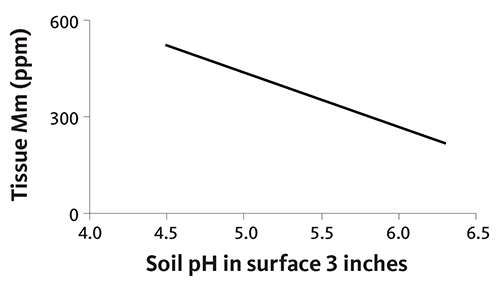
Soil test Ca typically increases as soil pH increases (Figure 14). However, no clear linkage was evident in data from the 2001–2002 survey.
Needle Ca does not vary with soil Ca supply (Figure 15). In our 2001–2002 survey of Christmas tree plantations, needle Ca concentration was not related to rotation age, although soil Ca tended to decrease with rotation age. All needle Ca concentrations were sufficient, even with declining soil Ca values.
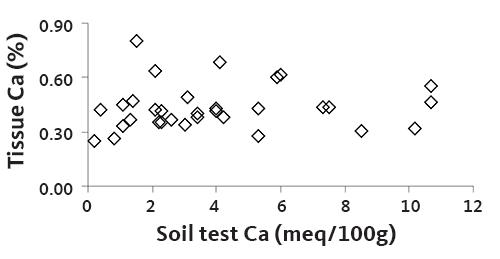
One reason that needle Ca concentration is independent of soil Ca is that Christmas trees do not depend entirely on the soil for Ca. Recent research shows that wind-borne Ca originating in soil or the ocean can be deposited on needles and used by coniferous trees.
Furthermore, Ca moves through the Christmas tree trunk, branches, and needles with water flow.
Unlike nutrients that move with photosynthate, proteins, or other compounds, water-transported nutrients are unlikely to increase proportionally in plant tissues when the soil supply increases.
Ca fertilizer decisions
Although Ca deficiencies are extremely rare in Christmas tree production, you should be alert to the possibility of declining soil test Ca. Allowing soil pH to drop below 5 and soil test Ca to fall below 2 milliequivalents per 100 grams of soil is not prudent.
Table 7 gives recommendations for supplying Ca through lime applications. Increasing soil pH and soil test Ca in the tree root zone is not practical after trees are planted, so lime must be applied and incorporated before planting.
Gypsum (calcium sulfate) is an alternative source of Ca and can be used if you wish to increase soil Ca without raising soil pH. It usually is more expensive than lime.
|
Ca test value (meq/100 g soil) |
Soil pH |
Rate (ton lime/acre)a |
Comments |
|---|---|---|---|
| below 5 | below 5.0 | Add lime as indicated by SMP buffer test (Table 6) | See “Magnesium” to determine whether dolomitic lime is needed |
| below 5 | 5.0–5.5 | 1 | See “Magnesium” to determine whether dolomitic lime is needed |
| above 5 | above 5.5 | Monitor foliar Ca and Mg | — |
aRecommendations based on ammonium acetate extractable soil test calcium.
Magnesium
Magnesium is a component of chlorophyll. Deficiencies cause chlorosis (yellowing) of needles.
Mg deficiencies have not been documented for Christmas tree production in western Oregon and Washington, even when Mg soil test values are below 0.4 milliequivalents per 100 grams of soil (48 parts per million).
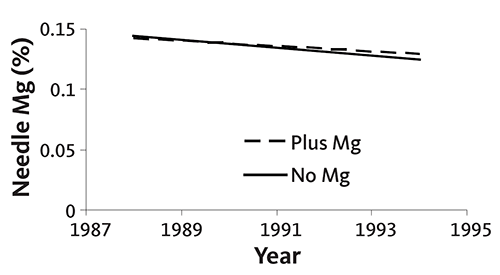
Addition of Mg has not increased needle Mg concentration, tree color, or growth even with soil test Mg as low as 0.25 milliequivalents per 100 grams of soil (30 parts per million). In an experiment at seven sites planted with noble fir, soil test Mg in the surface 8 inches ranged from 0.25 milliequivalents per 100 grams of soil (30 parts per million) to 4 milliequivalents per 100 grams of soil (480 parts per million). At most sites, soil test Mg was between 0.25 and 0.50 milliequivalents (30 to 60 parts per million). Application of 28 pounds of Mg per acre annually for 6 years did not increase needle Mg concentration at any site (Figure 17). The slight decline in Mg needle concentration shown over time is normal.
Mg fertilizer decisions
To be safe, Table 8 recommends Mg application when soil test Mg is below 0.4 milliequivalents per 100 grams of soil (48 parts per million).
|
Test value (meq/100 g soil) |
Soil pH |
Ratea (ton dolomite/acre or lb Mg/acre) |
Comments |
|---|---|---|---|
| below 0.4 | below 5.5 | 1 ton dolomitic lime/acre | — |
| below 0.4 | above 5.5 | 100–200 lb Mg/acre | Supply Mg as K-Mag or Epsom salts |
aRecommendations are based on the ammonium acetate laboratory test method. Recommendations are designed for a soil sample from the soil surface to a depth of 6 or 8 inches.
Summary
Table 9 summarizes preplant fertilizer recommendations for noble fir Christmas trees. Remember, preplant nutrient applications should always be based on soil test results.
|
Test value |
Rate |
Commentsa |
|---|---|---|
|
Phosphorus (P) |
||
| 0–10 ppm | 180 lb P2O5/acre | Bray |
| 11–15 ppm | 90 lb P2O5/acre | |
| above 15 ppm | Adequate; monitor foliar P | |
|
Potassium (K) |
||
| below 75 ppm | 100–200 lb K2O/acre | Ammonium acetate extractable |
| above 75 pm | Adequate; monitor foliar K | Ammonium acetate extractable |
|
Soil pH |
||
| below pH 5.0 | Add lime according to SMP buffer test (Table 6) | See “Magnesium” to determine whether dolomitic lime is needed |
| pH 5.0–5.6 | Consider adding 1–1.5 ton lime/acre | See “Magnesium” to determine whether dolomitic lime is needed |
| above pH 5.6 | No lime needed | |
|
Calcium (Ca) |
||
| soil Ca below 5 meq/100 g soil and pH below 5.0 | Add lime as indicated by SMP buffer test (Table 6) | Ammonium acetate extractable. See “Magnesium” to determine whether dolomitic lime is needed |
| soil Ca below 5 meq/100 g soil and soil pH between 5.0 and 5.5 | 1 | Ammonium acetate extractable. See “Magnesium” to determine whether dolomitic lime is needed |
| Soil Ca above 5 meq/100 g soil and soil pH above 5.5 | Monitor foliar Ca and Mg | |
|
Magnesium (Mg) |
||
| soil Mg below 0.4 meq/100 g soil and soil pH below 5.5 | Add 1 ton dolomitic lime/acre | Ammonium acetate extractable |
| soil Mg below 0.4 meq/100 g soil and soil pH above 5.5 | Apply 100–200 lb Mg/acre | Ammonium acetate extractable. Supply Mg as K-Mag or Epsom salts |
aRecommendations are based on the listed lab test methods. Bray and ammonium acetate refer to methods used for soil analysis. Recommendations are designed for a soil sample from the soil surface to a depth of 6 or 8 inches.
Seedling establishment and early rotation
The first year following planting begins the establishment phase (Figure 18). There is little benefit from applying nutrients at this time. The nursery environment is nutrient-rich, and nutrients are stored in seedlings. Newly planted trees have a nutrient concentration approaching double that needed for adequate field growth. For example, nursery stock commonly has 3% to 4% N in the needles, while older field-grown trees have 1.5% to 2% N. This high level of tissue N supplies growth needs during establishment.
Excessive fertilization, improperly calibrated rates, and poor fertilizer placement easily damage first-year seedlings and supply weeds with nutrients, making them more competitive with small trees.
If you have not yet performed the soil analyses and treatments discussed in “Site preparation,” follow the recommendations for taking a soil sample found in that section. Nutrient additions, particularly of nonmobile elements such as P, K, Ca and Mg, are difficult after planting. However, if the trees are in their first growing season, you likely can incorporate these elements between rows with minimal root damage.
Mid-rotation
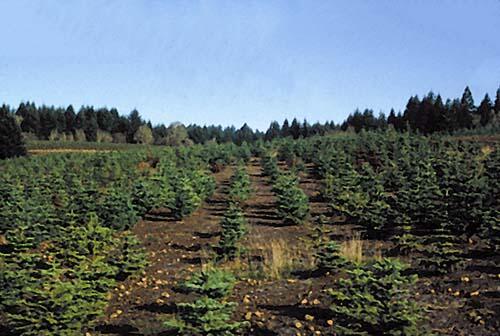
During the second or third year for Douglas-fir and the third or fourth year for noble fir, roots begin to fill the soil as the trees grow rapidly (Figures 19 and 20). Growers want to shape this rapid growth into a “frame” that can display and support the tree’s foliage. Inadequate nutrients at this stage can limit growth, so fertilizer applications can be beneficial.
Foliar analysis (tissue sampling) is the primary tool for nutrient management at the mid-rotation stage. Annual foliar analysis is recommended for trees three years of age and older.
Foliar analysis determines the amount of nutrients present in needles at the time of sampling. It indicates which nutrients are accumulated in adequate, deficient or excessive amounts. Detection of declining foliar nutrient levels allows fertilizer to be applied before nutrient deficiencies impair tree growth, quality or both.
Regular tissue sampling and analysis can help you decide whether fertilizer is needed, how much fertilizer to apply, and what kind to use. Recommendations based on foliar tests are designed to keep trees healthy and, in the case of N, to ensure adequate growth and sufficient color.
Addition of nutrients when tissue concentration is sufficient will not result in faster growth, more growth, or a darker color. No economic benefit will be obtained when nutrients already present in sufficient quantities are added. Knowing which nutrients are needed and purchasing only needed fertilizer makes both environmental and economic sense — it will save you money.
Tissue sampling and analysis
This section is geared primarily toward commercial Christmas tree growers and those who advise growers on nutrient management practices. Growers with smaller acreage (5 to 10 acres of trees) can benefit from this information, but should carefully consider adjusting sampling and other management practices for their scale.
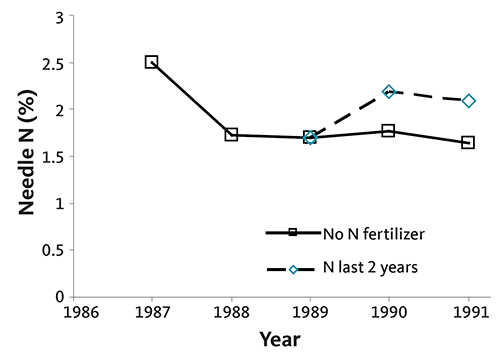
Tissue analysis is recommended on an annual basis for trees three years and older. This gives the transplanted trees two years to acclimate. Earlier sampling is not needed, as trees from the nursery usually contain adequate N (about 2%) and usually maintain a needle N concentration above 1.8% two years after transplanting. Needle N and color can be changed with N application a year or two before harvest.
Tissue sampling and analysis can be used for all Christmas tree species, although our ability to interpret the results varies. For noble and Douglas-fir, needle nutrient standards for many elements have been verified through field trials in Oregon (see Table 10). The guidelines in this publication are based on these field trials.
Other species can be sampled and analyzed following the same procedures. However, the tissue nutrient standards provided in this publication for grand and Nordmann fir are based on a combination of experience and data from Idaho and Denmark rather than local field trials (see Table 11). We feel these standards provide reasonable initial guidance for fertilizing these species.
Designing a sampling program
Annual sampling is ideal for gathering nutrient status information. Some Christmas tree growers feel annual sampling is not necessary or financially feasible. This idea may be “penny wise and pound foolish,” as the needle analysis cost is less than the value of a few trees. Not taking tissue samples or waiting until the year before harvest may allow very costly problems to develop. An unexpected nutrient deficiency can delay marketing a year, adding an extra year of production cost and delaying the start of the next rotation. Regardless of whether you sample every year, develop a plan for regular sampling beginning at mid-rotation or by year three.
One approach is to divide your acreage into two or three groups and sample one group of fields each year. In this way, you will sample one-half or one-third of the acreage each year. Begin with fields that are not growing as desired and sample them annually until the problem is corrected. For fields that are growing normally, we recommend sampling Douglas-fir plantations at least every other year and noble fir at least every third year beginning at three years or 3 feet height.
At the very least, sample two years prior to harvest. Take late-rotation samples so results are available to make changes in your fertilizer program for two growing seasons before harvest. Measuring tissue nutrient concentration during the final years of a rotation can help you make decisions about color development and marketability.
Keep in mind that changes in N tissue analysis may not occur for one or two years after fertilizer application. Even more time may be needed to measure the result of fertilizer application when immobile materials (P or K) are applied to the soil surface.
When to sample
Consistency in sampling is important. Sample needles annually at the same time of year.
Sampling must be done when needle nutrient concentrations are stable. Samples collected just a few days apart during periods of rapid change in nutrient concentration can give quite different results. We recommend February as the best month to sample Christmas tree needles for analysis. Recommendations in this guide are based on sampling at this time. Samples taken during other times of the year cannot be interpreted with confidence using data from this publication.
If problems such as poor growth or discoloration of needles appear during the growing season, you can use a comparative tissue test at any time to check for possible nutrient deficiencies. However, when sampling outside the recommended time period, you also must collect a companion sample from an unaffected area for comparison.
Why sample during winter?
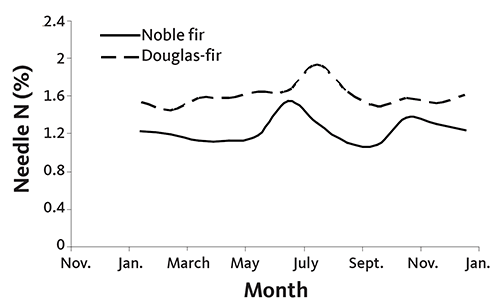
Figure 24 shows that tissue N concentration is relatively stable from January through April for Douglas-fir and noble fir.
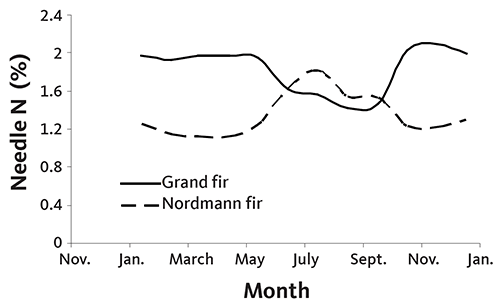
Grand and Nordmann fir also show seasonal patterns, with rapidly changing values in the summer and a period of stable needle N concentration in the winter (Figure 25). Note the higher winter needle N concentration in grand fir compared to other species, especially noble fir. No N fertilizer was applied to the grand and noble fir.
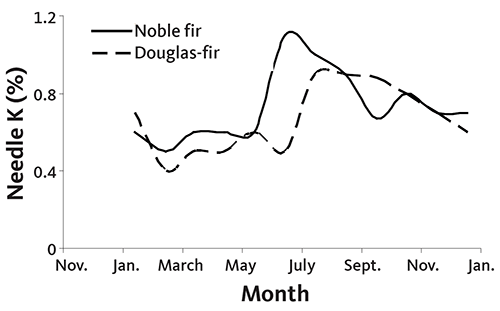
Unfortunately, not all nutrients follow the same seasonal pattern as N. As shown in Figure 26, K concentration in new growth is double the winter concentration and is not stable in Douglas-fir or noble fir until late winter or early spring. Needle K also changes throughout the year in Nordmann and grand fir. This pattern creates a dilemma for growers who might want to wait until K levels are stable to sample. Sampling in April does not allow sufficient time for sampling, analysis, and fertilizer application while rainfall is available to move the fertilizer into the tree root zone.
Our research showed that needle concentration of B, Ca and P are stable in all species in late winter, as is Mg concentration in Nordmann and noble fir, S concentration in Douglas-fir and Zn concentration in noble and Douglas-fir.
Our conclusion is that overall needle nutrient concentration is most constant during February. Sampling during this time also allows time for fertilizer application with ample moisture for incorporation of fertilizer.
Data for Figures 24–26 are from a project completed in 2006 that measured Douglas, noble, grand, Nordmann and Turkish fir needle nutrient concentration monthly for a year.
How to sample
Take samples from areas of a field with common soil and tree characteristics. A single sample should not represent more than 40 acres.
- Select needles from the upper one-third of the tree crown (Figure 27). Never sample the tree leader or lammas (summer flush) growth (Figure 28).
- Collect needles that are free of disease or other damage if possible.
- Pick needles without breaking them. Leave the bark on the tree. Include only needles in the sample — no buds, bark or stem wood (Figure 29).
- For each tree you sample, pinch five to eight needles of new or current-season growth from each of six to eight whorls (Figure 30).
- Repeat this procedure on 20 to 30 trees. Sample trees that are of similar age, color and growth.
If you have a field with mixed-age trees, see “Sampling choose-and-cut fields.”


Sample handling
Do not wash the needle samples. Put needles in a paper — not plastic — bag (Figure 31). Send them to a laboratory as soon as possible, preferably the day they are collected or the next day. Needles do not have to be refrigerated if they are shipped to the laboratory within a day of sampling.
Analyses to request
Laboratories usually provide tissue analyses in a group of elements or “package.” Most laboratories provide several groups or packages of elements.
We recommend that you request needle analyses of the following nutrients:
- Boron — B has increased growth of coniferous forest species in the Pacific Northwest, especially in areas with sandy soil such as western Washington.
- Calcium..
- Magnesium
- Manganese — to monitor soil pH decline.
- Nitrogen — N is the nutrient most likely to limit growth and color for Christmas tree production in western Oregon and Washington. Request a measure of “total N” rather than a form of N such as nitrate-N (NO3-N).
- Phosphorus.
- Potassium — K is deficient in a few plantations.
- Sulfur.

Information about Christmas tree micronutrient need is limited. No local research has evaluated metallic micronutrient application. Thus, needle nutrient concentration standards and recommendations are not available. Even so, needle analyses for these elements are recommended. For more information, see "Micronutrients.”
For a list of laboratories that perform tissue analyses, see Get actionable results from a soil, plant or environmental testing lab (EM 8677).

Interpreting laboratory results
Interpretation of laboratory results is a combination of philosophy and science, tempered with experience, and enhanced with a dash of artistry. The process used for this publication is explained in “Terms used to describe tissue concentration.”
Fertilizer decisions for individual nutrients are discussed on later in this section. As you compare your tissue test results to the values presented, keep the following points in mind.
Nutrient concentration values indicated as “adequate” in this publication are based on field trials in western Oregon and Washington, grower experiences and data from literature. These values are based on needle samples taken as prescribed in this publication. Needle sampling methods in other regions may differ. Since needle position influences nutrient concentration, use guidelines from other areas with caution. See ”Appendix 5” for more information.
Since N is the most likely limiting nutrient, most of our research has dealt with N. Our work with other nutrients is not definitive, but allows us to make an estimation based on experience. The nutrient concentration values provided are reasonable guidelines, but your trees may have slightly lower nutrient concentration and be healthy.
Although samples are taken before current-year growth, they reflect nutrient supply and growing conditions from the previous season. Needle nutrient concentration can be considered an evaluation or “report card” of last season’s management or fertilizer program. As you plan nutrient additions for the current year, consider the influence of fertilizer application, other management practices and conditions during the previous season.
Fertilizer decisions should be based on a combination of tissue test results and plant growth. Always review last season’s plant growth before applying fertilizer. Average mid-rotation upper-whorl lateral branch growth is 12 inches for Douglas-fir, 10 to 12 inches for grand fir, 8 to 10 inches for Nordmann fir, and 7 to 9 inches for noble fir. Use the following guidelines to evaluate fertilizer need.
Low tissue analyses and normal growth. If tissue analysis results are lower than values in Table 10 or 11 and growth is adequate, apply fertilizer at rates recommended on pages 25–30. This situation is unusual and is most likely to occur with mobile nutrients (for example, when the N supply is depleted after minimally meeting tree requirements).
Low tissue analyses and abundant growth. If growth is luxurious, don’t apply additional fertilizer. This situation is usually caused by oversupply of N. Lower than adequate tissue nutrient concentrations are common with excessive growth. In this situation, low tissue nutrient concentration occurs because the nutrient content of the tissue is diluted by the intensive growth. This condition should correct itself when growth returns to normal. Therefore, do not apply extra fertilizer, especially N, to correct low tissue concentration in a situation of excessive shoot growth.
Low tissue analyses and weak growth. If tissue analysis results are lower than values in Table 10 or 11 and growth is weak, discolored, or stunted, apply fertilizer at rates recommended in “N fertilizer decisions.”
Normal tissue analyses and normal or above-normal growth. If your tissue analyses are within the normal range and growth is good, continue with your current fertilizer program.
Normal or above-normal tissue analyses and weak growth. If trees are weak, discolored, or stunted, and tissue analyses are normal or above normal, look for stress from pests, poor drainage, drought, frost or other factors. Application of fertilizer to plants stunted by disease or insects usually does not help them overcome the situation. Eliminate the problem rather than adding nutrients.
Above-normal tissue analyses and normal or above-normal growth. If results from your sample are above the values in Table 10 or 11, the trees have an adequate supply of nutrients. Fertilizer application is unlikely to increase growth, color or profit. If tissue analyses are above normal and growth is adequate or above normal, reduce the amount of fertilizer, especially N.
|
|
Douglas-fira |
Noble firb |
|---|---|---|
|
Macronutrient |
(%) |
(%) |
| Calcium (Ca) | 0.25 | 0.25 |
| Magnesium (Mg) | 0.07 | 0.07 |
| Nitrogen (N) | 1.6 | 1.4 |
| Phosphorus (P) | 0.15 | 0.15 |
| Potassium (K) | 0.6 | 0.6 |
| Sulfur (S) | 0.06 | 0.06 |
|
Micronutrient |
(ppm) |
(ppm) |
| Boron (B) | 15 | 15 |
| Copper (Cu) | 3 | 3 |
| Iron (Fe) | unknown | unknown |
| Manganese (Mn) | 25 | 25 |
| Zinc (Zn) | 10 | 10 |
|
|
Grand fira |
Nordmann firb |
|---|---|---|
|
Macronutrient |
(%) |
(%) |
| Calcium (Ca) | 0.75 | 0.1 |
| Magnesium (Mg) | 0.12 | 0.5 |
| Nitrogen (N) | 1.9 | 1.4 |
| Phosphorus (P) | 0.18 | 0.16 |
| Potassium (K) | 0.6 | 0.5 |
| Sulfur (S) | 0.12 | 0.09 |
|
Micronutrient |
(ppm) |
(ppm) |
| Boron (B) | 35 | unknown |
| Copper (Cu) | 3 | unknown |
| Iron (Fe) | unknown | 45 |
| Manganese (Mn) | unknown | 50 |
| Zinc (Zn) | 25 | 15 |
aValues are a combination of data from Idaho, where N, P, K, and S were added to trees with the above nutrient con-centrations, and from unfertilized trees in western Oregon. Addition of fertilizer did not increase the commercial value of Christmas trees that were growing as expected and had sufficient color. These tissue concentration values are adequate, and lower concentrations may be sufficient.
bData are from Denmark. Sampling time is similar to that recommended in this guide (March), but samples were taken from the upper whorl on the south side of the tree.
Additional considerations
Tissue analysis outside the normal range cannot always be attributed to your fertilizer program. The condition of the trees and the site are important variables. For example, trees growing on a site with heavy weed competition may not show any growth or color change from fertilizer additions, as the weeds use the added nutrients. Or, insufficient nutrient concentration can be caused by saturated or dry soils that impede nutrient uptake.
Root problems can also limit nutrient uptake. Roots are the first part of the tree to encounter nutrients. If roots are damaged by disease or restricted by compaction, top growth will be delayed until they recover.
In addition, high temperatures; prolonged drought; frost; shade; weed, insect, or disease presence; or herbicide injury can affect growth, color, and needle nutrient concentration.
Tree response to fertilization
For annual crops such as potatoes, sugar beets or lettuce, tissue analysis can be used to monitor, predict and adjust fertilizer use during early growth stages. By using a tissue test, growers can adjust fertilizer supply during the season for these annual irrigated crops. Irrigation water can be used to move nutrients into the soil. This seemingly “immediate” change in crop growth from a fertilizer application should not be expected for Christmas trees.
Christmas trees and other nonirrigated woody perennial crops react differently to fertilizer application than do fast-growing annual crops. They have a “memory,” and changes in nutrition are not immediately evident in improved growth. If a tissue test indicates that fertilizer is needed and it is applied, no change in tissue concentration or growth may occur for one or two seasons. Be patient. Refrain from adding “just a bit more” fertilizer, as the trees could be injured or burned from a high dose of fertilizer.
N fertilizer decisions
Apply fertilizer N if needle N concentration is below 1.6% for Douglas-fir or 1.4% for noble fir. See Table 12 for Douglas-fir and noble fir N fertilizer rates. Be sure to consider tree growth when making fertilizer decisions.
|
N foliar analysis (%) |
Rate (lb K2O/a) |
|---|---|
| below 0.4 | 100 |
| 0.4–0.6 | 50 |
| 0.6–0.8 |
if soil test K above 75 ppm — 0 if soil test K below 75 ppm — 50 |
aChoose-and-cut growers can use tree height to gauge N rate. Apply 1 oz of urea or 2 oz of a fertilizer with approximately 20% N per foot of tree height.
N management is site-specific
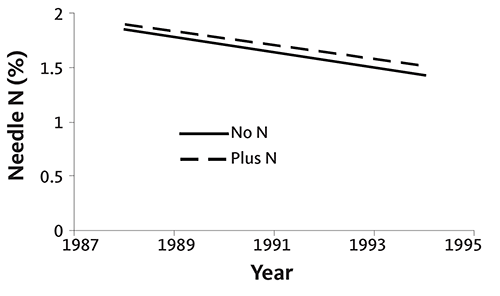
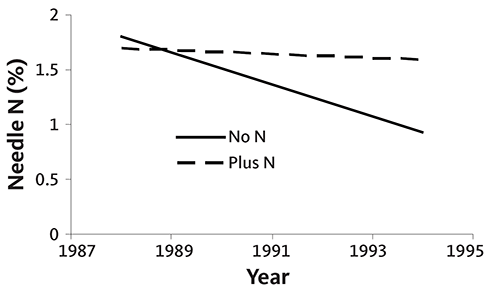
Figures 34 and 35 are graphs of annual needle N concentration from two noble fir plantations on upland sites in southwestern Washington. Needle N concentration did not increase following N fertilizer application in one plantation (Figure 34), but did at the other (Figure 35). Although needle N concentration was similar at both sites early in the rotation, it fell rapidly without fertilization at the second site. At that site, N fertilizer was necessary to produce top-quality trees, since the needle N concentration was below 1.4% at harvest. This example demonstrates the importance of a needle analysis program: due to differences among fields, N fertilizer does not always produce an economic return.
Needle N is high in nursery trees (usually 3% or more). The rate of decline in needle N concentration is site-specific, as shown in Figures 34–37. Some sites maintain adequate needle N concentration for growth and color development (Figures 34 and 36), while other sites (Figures 35 and 37) require supplemental N near the end of the rotation.
These examples illustrate two important points:
- N supply varies among sites, so N management must be site- or field-specific.
- Tissue or needle analysis can indicate N needed.
N application
The recommendations in Table 12 are for N applied in late winter. Apply fertilizer in February or March. Fall application of N has not increased growth, color or needle N concentration. In addition, fall N application is vulnerable to leaching during the late fall and winter.
A large single N application increases the risk of N leaching. Consider splitting N into smaller annual doses. An example of N application for the final three years of a rotation is to apply 50 pounds of N per acre the first year and then increase the rate to 100 pounds of N per acre two years before harvest. Always base annual N applications on foliar analyses.
Phosphorus
Needle P concentration above 0.15% is adequate, 0.08% to 0.15% is marginal, and below 0.08% is deficient (Table 13). Apply P on a trial basis when needle P is marginal. Leave an area that does not receive P and compare trees in both areas.
Because P moves into the soil slowly, apply P fertilizer as soon as convenient, and preferably before winter rains. Phosphorus is more effective when applied preplant and incorporated.
|
P foliar analysis (%) |
Rate (lb P2O5/acre |
|---|---|
| below 0.08 | 180 |
| 0.08–0.15 | 90 |
| above 0.15 | 0 |
Begin foliar analysis in February of the third growing season after planting. Reanalyze every other year to deter-mine whether deficiencies have been corrected.
Potassium
Potassium application recommendations based on needle sampling are given in Table 14. Needle K concentration between 0.6% and 0.8% is considered normal or sufficient. No evidence of a K deficiency exists when needle K concentration is between 0.6% and 0.8%; however, K application is suggested if needle K concentration is within this range and soil test K is below 75 parts per million.
Because K moves into the soil slowly, apply K fertilizer as soon as convenient, and preferably before winter rains. Potassium is more effective when applied preplant and incorporated.
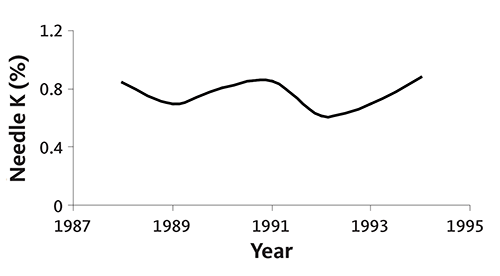
A single needle test for K can be difficult to interpret, especially in the absence of soil test data, as needle K concentration can fluctuate significantly from year to year (Figure 38). The data in Figure 38 are from needle samples collected in late summer, typically the driest time of the year. Potassium moves into the tree with water flow. Thus, needle K is lower when trees are moisture stressed than when sufficient soil moisture is present. In the late summer and early fall of 2002, we sampled needles from 32 Christmas tree plantations. The average needle K concentration was below the OSU standard even though trees did not exhibit signs of K deficiency.
This fluctuation in needle K concentration is one reason for changing the recommended time for needle sampling from late summer to late winter in western Oregon and Washington. By sampling during a moist time of year, there should be less fluctuation in needle K concentration.
|
N foliar analysis (%) |
Rate (lb K2O/a |
|---|---|
| below 0.4 | 100 |
| 0.4–0.6 | 50 |
| 0.6–0.8 |
if soil test K above 75 ppm — 0 if soil test K below 75 ppm — 50 |
Begin foliar analysis in February of the third growing season after planting. Reanalyze every other year to determine whether deficiencies have been corrected.
Calcium and magnesium
Calcium and Mg rates based on foliar tests are provided in Table 15. Because of the need to incorporate these materials into the soil, seek professional advice if adding them during mid-rotation. If Mg is needed during a rotation, choose a soluble source such as magnesium sulfate (Epsom salts) or potassium magnesium sulfate (K-mag). Because Ca and Mg move into soil slowly, apply these materials as soon as convenient, and preferably before winter rains.
|
Nutrient |
Foliar analysis (%) |
Rate |
|---|---|---|
| Calcium (Ca) | below 0.25 | 1,000 lb gypsum/acre or 1 ton lime/acre |
| ~ | above 0.25 | 0 |
| Magnesium (Mg) | below 0.07 | 20–40 lb Mg/acre |
| above 0.07 | 0 |
Begin foliar analysis in February of the third growing season after planting. Reanalyze every other year to deter-mine whether deficiencies have been corrected.
Sulfur
The need to add S as a fertilizer material has not been documented for Christmas trees grown in western Oregon or Washington. Sulfur deficiency was suspected on the Olympic Peninsula for some Douglas-fir, as the trees had poor color. Tree color improved when both N and S were added, but not when only N was added. Without a history of S deficiency, identification of situations in which S application is needed is impossible.
Soil testing for S is ineffective
Soil testing to predict sufficiency or deficiency of sulfate-S is not recommended for Christmas tree production in western Oregon and Washington. Soil testing for S is complicated by two factors:
- Seasonal fluctuations in soil sulfate levels.
- Significant differences in sulfate-S levels in surface soil and subsoil.
Table 16 illustrates that sulfate-S is sometimes twice as high in the subsurface as in the surface soil, making a surface soil test difficult to use for predictive purposes.
Application of sulfate-S may not increase needle S concentration (either total S or sulfate-S), needle color, or tree growth. Two experiments were conducted that confirm this conclusion.
|
Soil depth (inches) |
Soil test S (ppm) |
|||
|---|---|---|---|---|
|
Site 1 |
Site 2 |
Site 3 |
Site 4 |
|
| 0–8 | 6 | 19 | 15 | 7 |
| 9–16 | 10 | 33 | 29 | 12 |
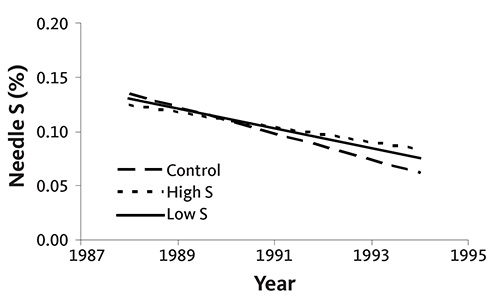
In the first experiment, ammonium sulfate and potassium magnesium sulfate were applied annually to noble fir Christmas trees growing on a site with high soil test S. S was applied at rates ranging from 0 to 165 pounds of S per acre. Needle S concentration decreased as tree age increased, regardless of S application (Figure 39). When no S was supplied for the entire rotation, needle S concentration at the end of the rotation was only slightly lower than in treatments receiving S. Needle S concentration was the same for all treatments receiving S, regardless of application rate.
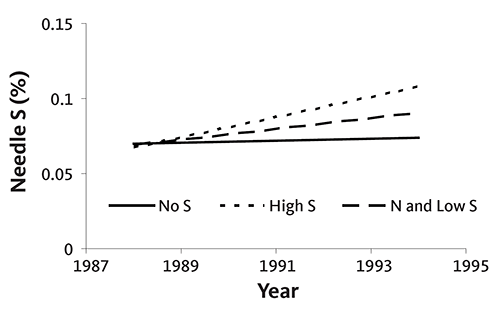
In the second experiment, needle S concentration increased slightly with tree age at a site with low soil test S (Figure 40). However, S fertilizer did not significantly increase tissue S concentration. The average S concentration without S application was 0.07%; with S, it was 0.08% (low S application rate) or 0.09% (high S application rate). In the same experiment, tree (needle) color was not related to needle S concentration.
These two examples are complicated by differences in genetics and treatment in nurseries. Trees planted at the site represented by Figure 39 could have received more S in the nursery than trees planted at the site represented by Figure 40.
In both cases, however, the data confirm that additional S will not increase growth or tissue total S concentration where S nutrition is adequate.
Sulfur fertilizer decisions
Application of S fertilizer may be prudent when very low needle S concentration is measured.
Evaluate S sufficiency or deficiency carefully based on multiple measurements, observation of tree growth and color, understanding of analytical procedures, and common sense. Carefully evaluate potential benefits of S application before applying the material.
|
S foliar analysis (%) |
Rate (lb S/acre) |
|---|---|
| below 0.06 | 20–30 |
| above 0.06 | 0 |
Total needle S and N:S ratio are recommended as initial measurements. A Christmas tree with even a 16:1 N:S ratio can produce excellent color and growth.
The critical total S concentration for Christmas trees grown in western Oregon and Washington is 0.06% (Table 17). This concentration was chosen after examining total needle S, tree color, grade, and total value on approximately 10 experimental sites (noble fir and Douglas-fir). The average total S concentration for all trees in the plots was 0.11%. This concentration is low compared to other crops, which typically have total S concentrations of 0.2% to 0.5%.
If total S concentration is below 0.06%, an experimental application of S (Table 17) is advisable. Apply S fertilizers in February or March.
Micronutrients
Information about Christmas tree micronutrient need is limited. No local research has evaluated metallic micronutrient application. Thus, standard recommendations are not available for situations where foliar nutrient concentrations are at or below values in Table 18.
In trees grown on soils listed in “Introduction,” tissue concentrations of metallic micronutrients (Fe, Mn, Zn and Cu) are usually adequate (Table 18). These nutrients are readily available in the region’s acidic soils. If trees planted following the guidelines in “Site preparation” show a low tissue concentration of micronutrients, excess lime may have been applied or excessive growth from high rates of N fertilizer may have diluted the needle micro-nutrient concentration.
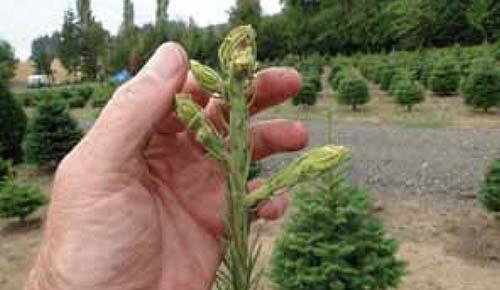
Although B deficiency has not been identified in Christmas trees, it has been shown to be limiting in a recently planted Douglas-fir timber plantation on gravelly glacial outwash soil in southwestern British Columbia. Boron deficiency affects the apical or growing points of plants. Boron-deficient Douglas-fir trees exhibited swollen leaders, increased death of leaders and lateral growth, and curling and rosette growth of needles. A trial application is recommended when needle B concentration is below the 15 parts per million standard in Table 18. A single B application of 2 to 3 pounds of B per acre should provide adequate B for the life of the stand. Once B has been applied, wait until the next foliar test before considering another B application. Broadcast B fertilizers; never band. Damage to trees can result from overapplication of B.
Note that several fungicides contain plant nutrients. Because tissue samples are not washed before analysis, high Cu, Mn or Zn may be the result of fungicide residue. High B, Cu and Zn also may occur if liquid or foliar fertilizer was used.
|
Nutrient |
Foliar nutrient concentration below which nutrients may be needed (ppm) |
Comments |
|---|---|---|
| Boron (B) | 15 | Broadcast 3 lb B/acre. Can be toxic if banded or overapplied. |
| Zinc (Zn) | 10 | Generally is not deficient in acid soils of western Oregon and Washington. |
| Manganese (Mn) | 25 | Generally is not deficient in acid soils of western Oregon and Washington. Moni-tor to indicate soil pH decline. |
| Copper (Cu) | 3 | Generally is not deficient in acid soils of western Oregon and Washington. |
| Iron (Fe) | uncertain | Foliar analysis is unreliable and not recommended. |
Begin foliar analysis in February of the third growing season after planting. Reanalyze every other year to determine whether deficiencies have been corrected.
Custom blending of fertilizers to supply micronutrients and other fertilizers is common in the fertilizer supply industry. Consult a fertilizer dealer or other professional regarding application rates and methods of applying micronutrients.
N fertilizer, soil pH and increasing needle manganese
Christmas tree needle Mn concentration commonly is between 25 and 200 parts per million. Needle Mn concentration usually increases with stand age and N application, as shown in Figure 41 and Table 21. The increase in needle Mn is related to the decrease in soil pH caused by N fertilizer application.
Christmas tree needles accumulate Mn as soil pH declines, as shown in Figure 42. Needle Mn concentration increases by 150 to 200 parts per million as soil pH decreases from 5.8 to 4.8. The increase in needle Mn with declining soil pH is likely to be greater when soil pH is below 4.8, since the plant-available form of Mn increases rapidly below soil pH 5.2 in most soils. The rate of needle Mn increase is soil- and site-specific, so your plantation differ.
A toxic needle Mn concentration has not been defined. In a German study, Douglas-fir trees showed no symptoms of Mn toxicity until the needle concentration exceeded 7,000 parts per million.
Monitoring the increase in needle Mn concentration is an alternative to monitoring soil pH. Measure soil pH before planting and then monitor needle Mn concentration annually as a pH indicator. If needle Mn is greater than 250 parts per million and increases annually by more than 40 parts per million for two or three consecutive years, measure soil pH and evaluate lime need before the next rotation. See “Soil acidity, pH and liming” for information about managing soil pH.
|
OSU critical concentration (ppm) |
Average needle concentration (ppm) |
Range (ppm) |
||
|---|---|---|---|---|
|
First rotation |
Last rotation |
First rotation |
Last rotation |
|
| 25 | 325 | 416 | 83–570 | 140–1,010 |
Late rotation
As the plantation approaches harvest, it grows very rapidly, drawing more heavily on soil nutrients (Figure 43). Foliage quality is a critical concern. During this phase of the rotation, trees require more N than in earlier growth stages, and fertilizer applications must be adequate to support tree growth and color development. Soil deficiencies neglected to this point are difficult to correct.
Foliar analysis is the primary tool for assessing nutrient status. Collect and submit foliar samples as described under “Mid-rotation.” Compare foliar test results with values in Tables 10–18 to estimate amounts of nutrients to apply.
Trees grown in deep soils usually do not need N fertilization late in the rotation for growth. During the final two years, N applications may improve color, however, if foliar N levels are approaching 1.6% or lower. On shallow hill soils, N applications throughout the rotation may improve both growth and color, if foliar test results justify applications.
If needle N is constant and adequate for several years, late-rotation N probably will not be needed and will not provide an economic return. If needle N is declining, you should anticipate the possibility of a need for late-rotation N application to develop dark green color.
Spring application of N is most likely to improve tree color during the final two or three years of the rotation. Apply N, if needed, in February or March during the period of active root growth. Do not exceed 150 pounds of N per acre in any year.
Harvest-year fall fertilization is not likely to produce adequate color before harvest. The success of fall N fertilization is linked to fall rains. Early August or September rains provide a greater chance for color improvement. Even with adequate early rain, however, fall N did not increase needle N concentration in either Douglas-fir or noble fir (see “Fall N application”).
Postharvest
Postharvest is the time to reflect on the successes and areas for improvement of the previous rotation and to plan for the next rotation. Review soil and tissue data from the last several years. Consider the following.
Is needle Mn increasing rapidly? If so, lime may be needed. Collect soil for determination of soil pH and lime requirement. If sampling soil before tillage, separate soil from the surface 2 or 3 inches from the soil below. Top-dressing N fertilizer acidifies the soil surface, so pH may be lower in the surface 2 to 3 inches. See “Site preparation” for lime recommendations.
Consider the nutrients removed during a rotation. Tree harvest removes nutrients from your fields. The amount of nutrients removed varies with tree species, tree age at harvest, and post-harvest stump treatment. Table 23 shows nutrients removed in 6- to 7-foot tall Christmas trees. The next rotation will remove as many nutrients. Review soil test results, especially for K, and consider whether nutrients should be incorporated before planting. "Appendix 4," Tables 31–35 show nutrient content at harvest for tree roots, needles and trunks of Douglas-fir, Nordmann fir, noble fir and grand fir Christmas trees.
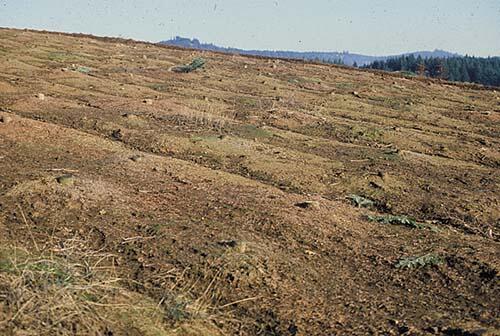
Evaluate the site and tree performance. If the trees did not grow as expected or desired, evaluate soil depth, and investigate the possibility of soil compaction, insect problems, or root diseases. The site may not be suitable for Christmas tree production if it is shallow or steep (Figure 44). Compacted soil can benefit from ripping when dry and from incorporation of a cover crop. Cover crops return organic material to soil. Fungi and bacteria decompose the plant material, slowly adding to soil organic matter. Soil organic matter is essential for Christmas tree production. It binds soil particles so that air, water and roots can easily move through the soil. Adding plant material to maintain soil organic matter is an important step in assuring long-term site productivity.
|
Nutrient |
Approximate amount removed (lb/acre) |
|---|---|
| Nitrogen (N) - Douglas-fir and grand fir | 125–175 |
| Nitrogen (N) - Noble fir and Nordmann fir | 200–300 |
| Phosphorus (P) | 15–25 |
| Potassium (K) | 50–150 |
| Calcium (Ca) | 75–125 |
| Magnesium (Mg) | 10–25 |
| Sulfur (S) | 5–15 |
Examples
Three examples of the decision process described in this guide follow. They serve as a review of how to use this guide with soil and foliar test results.
Preplant example
Douglas-fir Christmas trees will be planted on a third-rotation field. The grower collects a soil sample after harvest. The results are shown in Table 24.
- Preplant K or P applications are not needed.
- A soil pH of 4.6 shows lime is needed prior to planting. Table 6 provides interpretation for the SMP buffer value of 5.6. The lime recommendation is to incorporate 3 to 4 tons of 100-score lime to raise the pH to 5.6.
- Soil test results showed 2.4 milliequivalents per 100 grams soil of Ca and 0.35 milliequivalents per 100 grams soil of Mg. Tables 7 and 8 provide interpretation for Ca and Mg. Soil pH is less than 5.0, and soil Ca is less than 5 milliequivalents per 100 grams of soil. The lime recommendation based on the SMP buffer (3 to 4 tons) will supply sufficient Ca.
Dolomite is recommended when Mg is below 0.4 milliequivalents per 100 grams of soil. Table 8 recommends applying a maximum of 1 ton dolomite per acre per application. One ton of dolomite will provide sufficient Mg, and agricultural (calcitic) lime is a more economical choice for the remaining lime. Thus, the lime application should be split between 3 tons of agricultural lime per acre and 1 ton of dolomitic lime per acre. The grower works both agricultural lime and dolomite into the soil prior to planting.
|
pH |
Ca (meq/100g soil) |
Mg (meq/100g soil) |
SMP buffer |
K (ppm) |
P (ppm) |
|---|---|---|---|---|---|
| 4.6 | 2.4 | 0.35 | 5.6 | 124 | 17 |
Late-rotation example
A plantation is in the fifth year of a noble fir rotation. The grower took a preplant soil sample and followed recommendations. Foliar monitoring began in year 3. The fifth-year results are shown in Table 25.
The grower notes the following:
- The threshold for adequate N in noble fir is 1.4%. The fourth-year sample showed N levels at 1.4 %, so a downward trend seems evident. Foliar levels of 1.28% are low enough to justify N application of up to 100 pounds of N per acre this year (Table 12).
- P is acceptable; no fertilization is required (Table 13).
- K is low (0.6% compared with the recommended level of 0.8% in Table 14). The fourth-year sample had a K level of 1.1%. Such a large drop in K level in a single year is unexpected. Before taking action, the grower might consider the following.
- Does the low value fit with other observations and data? For example, was the pre-plant soil test also low?
- Was the season immediately prior to needle sampling unusually dry? K results can fluctuate depending on how dry the year has been. This explanation is likely since the fourth-year sample was adequate.
- The grower has two choices:
- Wait until next year and retest; if K is low because of drought, the level may change.
- Apply a surface band of 50 pounds of K per acre, as recommended in Table 14.
- Ca and Mg are adequate (Table 15).
- Foliar S is adequate, so no application is recommended (Table 17).
- Boron is at the threshold level (Table 18). Application of B is not essential for current tree growth, but rates below this level will be of concern. Three logical options are:
- Do not apply B now, but evaluate the situation again next year based on foliar analysis.
- Apply a half rate of B (1 to 1.5 pounds of B per acre).
- Apply the full rate of B (2 to 3 pounds of B per acre).
If the grower decides to apply B, a broadcast application of granular or liquid B is the best approach. Foliar and band applications of B are not recommended due to the possibility of overapplication.
- Zn and Mn levels are acceptable (Table 18).
- Cu is adequate (Table 18).
- Fe testing is not necessary for Christmas trees in western Oregon and Washington. Fe is analyzed routinely at no extra cost. Fe usually is high in our area, but no information exists on test interpretation.
|
N (%) |
P (%) |
K (%) |
Ca (%) |
Mg (%) |
S (%) |
B (ppm) |
Zn (ppm) |
Mn (ppm) |
Cu (ppm) |
Fe (ppm) |
|---|---|---|---|---|---|---|---|---|---|---|
| 1.28 (low) | 0.16 | 0.6 (low) | 0.4 | 0.1 | 0.15 | 15 (marginal) | 14 | 150 | 7 | 84 |
Continuous cropping example
The owner of a U-cut operation (Figure 45) has not worked the soil in 20 years. Most of the trees are Douglas-fir. Trees range from seedlings to 10 years of age and are grown on an three-year rotation.
To assess nutrient status of unevenly aged trees, the grower collects soil and foliar samples from trees within three years of harvest. Each species is sampled separately.
Soil and foliar test results are found in Tables 26 and 27.
The grower notes the following:
- The soil test results indicate moderately low pH. This pH level is sufficient, but the trend is a concern.
- Soil Ca is sufficient but marginal (Table 7). The level is consistent with a pH of 5.1.
- Mg is low (Table 8).
- Foliar test results indicate low N. According to Table 12, 1 to 2 ounces of N per tree will remedy the low foliar N level. The grower applies N to all trees that are within three years of harvest.
The grower has two options for addressing soil pH, Ca, and Mg levels:
- Clear a portion of the field and rework it as recommended in “Site preparation.”
- Incorporate appropriate amounts of calcitic and dolomitic lime during site preparation (Tables 6 and 8). These additions will correct pH and supply Ca and Mg. As time passes, the plantation will develop into smaller areas of evenly aged trees.
- Continue to plant seedlings as mature trees are harvested. Incorporate calcitic and dolomitic lime into backfill from auger holes. To find the per-tree rate (assuming 1,500 trees per acre), divide the per-acre recommendation by 1,500.
U-cut growers should take soil samples for analysis every five years.
|
pH |
Ca (meq/100 g soil) |
Mg (meq/100 g soil) |
SMP buffer |
K (ppm) |
P (ppm) |
|---|---|---|---|---|---|
| 5.1 (low) | 5.1 | 0.4 | 5.6 | 150 | 16 |
|
N (%) |
P (%) |
K (%) |
Ca (%) |
Mg (%) |
S (%) |
B (ppm) |
Zn (ppm) |
Mn (ppm) |
Cu (ppm) |
Fe (ppm) |
|---|---|---|---|---|---|---|---|---|---|---|
| 1.45 (low) | 0.16 | 0.9 | 0.4 | 0.1 | 0.15 | 25 | 14 | 150 | 7 | 784 |
Appendix 1. Methods of nutrient application
Nutrients can be supplied to Christmas trees by a variety of methods. An explanation of the options follows.
Hand application
Traditionally, fertilizers were applied to Christmas trees by hand — placing a tuna can of fertilizer around each tree. Hand fertilization has been used by hundreds of large and small growers on thousands of acres over the past 40 years. The method is easily explained, can be done by anyone, and requires minimal equipment. However, hand fertilization can be slow and labor-intensive on larger farms, and it risks inaccurate or variable application.
By using a measuring device such as a tuna can, you can apply a uniform amount of fertilizer to each tree. You can use the N recommendations in Table 12 to apply only the fertilizer needed, as indicated by foliar test results.
It’s best to divide the application for each tree into two portions and apply them under the drip line on opposite sides of the trunk. This “two-strike” method places half the material on each side of the tree. With concentrated fertilizers, this method is better than the “one-strike” method, which places all of the material under the drip line on one side of the tree.
Nonmotorized broadcast spreaders are an even better option, as they may be faster and apply material more evenly. Options include shoulder harness-style spreaders or hopper-style wheeled spreaders that are pushed by the operator (Figure 46). These systems lack the capacity of motorized systems, however.
Ground speed and spreader setting dictate application rate; take care not to change application speed during application. Wheeled spreaders require a relatively debris-free, smooth surface for optimal fertilizer application. Making a second pass 90 degrees to the first application can compensate for an uneven spread pattern.
Regardless of method, be careful to keep fertilizers off foliage, especially wet foliage, as they can cause needle burn (Figure 47).
Ground-based motorized application
Tractors, four-wheelers, and other equipment can be used to apply fertilizer as long as the equipment fits between the trees (Figure 48). These methods are ideal for broadcast and banded fertilizer applications. A well-calibrated ground-based motorized system is fast and even. Throttle or speed control makes application more uniform.
A variety of easily calibrated spreaders is available. Assess the economics of motorized versus nonmotorized systems for your situation.
Aerial application
When motorized spreaders do not fit between the trees, the most efficient way to apply nutrients is by aircraft. Because of the cost to move aircraft and loading equipment to a site, 8- to 10-acre fields are considered the minimum size for cost-effective treatment. Proper application depends on flight access clear of tall trees and power lines.
Foliar application
Foliar applications generally are not recommended. In any plant, nutrient uptake through the foliage is inefficient compared to uptake through roots. Foliar nutrient application is especially difficult in coniferous evergreen trees because their needles’ “waxy” coating and narrow shape limit nutrient penetration. Foliar applications also risk foliar burn, discoloration and needle loss.
Timing is critical if foliar-applied materials are to have any effectiveness. The needles’ waxy cuticle controls nutrient uptake. Immediately after bud break, needles lack a fully developed cuticle. Foliar-applied nutrients are most likely to enter the tree via the needles at this time, but the risk of foliar damage is also highest. This period also is the time of maximum nutrient uptake through the roots, which always is more efficient than nutrient uptake through foliage.
A variety of fertilizer materials is available.
Appendix 2. Nutrient sources
Some, such as urea, supply a single nutrient. Others, either standard or custom blends, supply more than one nutrient. This section reviews materials commonly used on Christmas trees in Oregon and Washington.
Choose materials carefully, taking into account specific site conditions and your interpretations of soil and foliar test results. Manufacturers frequently release new fertilizer materials. If you have questions about the suitability of a specific material for your plantation, consult an Extension agent or crop consultant.
Organic fertilizers
Nutrients can be supplied to Christmas trees by using organic sources. The choice of material and application rate is site- and year-specific. More information about choice of organic nutrient sources, including biosolids, is found in the following publications:
- Organic fertilizer and cover crop calculators
- Estimating plant-available nitrogen from manure, EM 8954
- Fertilizing with biosolids, PNW 508
Commercial nitrogen (N) sources
Several commercial fertilizer materials supply N in the ammonium and nitrate forms, which are immediately available to plants. The ammonium and urea forms of N are acidifying to the soil. Nitrate forms are not.
Urea
Urea (CO [NH2]2) is commonly applied as solid white N fertilizer. Urea contains 45% to 46% N, the highest N content of any dry fertilizer. It usually is the least expensive dry N material. It is easily blended with ammonium phosphates and ammonium sulfate. Urea’s solubility allows for use in fertilizer solutions, such as the urea- ammonium nitrate combinations commonly called “solution 32” because they contain 32% N. About 1 pound of urea will dissolve in 1 quart of water.
Growers commonly express two concerns about urea. The first is that the N will be lost to the atmosphere as ammonia gas. Substantial N loss from urea is not likely in western Oregon or western Washington unless lime has been applied recently or the soil pH is above 7.0. Although it is common for no trace of urea to be visible shortly after application, the N has not volatilized. Urea is extremely soluble in water and dissolves in heavy dew. The material then moves onto the soil surface in the area around the former granule.
A second concern about urea relates to tree damage from high concentrations of N. Small trees may suffer root damage from high application rates of urea. If urea is inadvertently applied to foliage, foliar damage may result.
Ammonium sulfate
Ammonium sulfate is a white crystalline solid with a grade of 21-0-0-24(S). It is a primary source of S.
Ammonium sulfate is applied alone or in blends with other granular fertilizers. The S is in a soluble and plant-available sulfate form, SO4. A common blend used in the Christmas tree industry, called urea-sul, is a mixture of urea and S. It typically contains 38% to 42% N and 8% to 10% S.
The use of ammonium sulfate as the only source of N is not recommended for Christmas tree production for several reasons. First, the material acidifies soil faster than ammonium nitrate or urea. Second, when used alone, it supplies many times the amount of S required in order to supply enough N. Therefore, if S is needed, use a blend containing ammonium sulfate.
Calcium nitrate
Calcium nitrate is a granular N carrier with 15.5% N and 21% Ca. In contrast to other common N-supplying materials, the N is in the nitrate form, which most plants take up preferentially.
This material does not acidify soil. This fact makes it useful for choose-and-cut, or “U-cut,” growers who annually replant between standing trees. Annual replanting eliminates the possibility of tilling the soil and mixing lime into the root zone.
Offsetting these benefits are calcium nitrate’s lower N analysis and higher cost compared to other N materials. The lower N analysis means that three times as much material must be applied compared to urea.
Some growers use calcium nitrate as a way to apply Ca. Calcium nitrate does supply Ca, but at a lower rate than lime. One ton of lime supplies about 800 pounds of Ca; an application of calcium nitrate sufficient to supply 75 pounds of N provides only 100 pounds of Ca. The Ca from calcium nitrate costs approximately 2.5 times more than Ca from lime. The Ca in calcium nitrate does not neutralize soil acidity, so it can’t be used in place of lime to raise soil pH.
Phosphorus (P) sources
Ammonium phosphate
Ammonium phosphate, as a granular or liquid material, is the most common P fertilizer available from commercial fertilizer suppliers. Granular ammonium phosphate is either monoammonium phosphate (11-52-0), diammonium phosphate (18-46-0), or ammonium phosphate-ammonium sulfate (16-20-0-14). The common grade of liquid ammonium phosphate is 10-34-0.
Rock phosphate
Rock phosphate is quite variable in grade, with a P2O5 content of 10% to 35%. Rock phosphate is unlikely to supply deficient Christmas trees with a usable supplement over the length of a tree rotation.
Potassium (K) sources
Two primary solid crystalline sources of K are available: potassium chloride (KCl, 0-0-60) and potassium sulfate (K2SO4, 0-0-52-18). The first material contains chloride, and the other contains S. Concentration of potassium chloride around a young tree can cause needle burn.
Boron (B) sources
Sodium borate is the most frequently used B fertilizer. B fertilizers are sold with trade names such as Solubor, Fertibor, Granubor, and Solu-bor DF, all of which are sodium borate. Most B fertilizers contain 10% to 20% B. Solubor is 20.5% B, and Granubor is 15% B.
Boron is fairly mobile in soils and can be applied by several methods. Boron sources can be blended with granular N-P-K fertilizers, but segregation can be a problem if particle sizes differ significantly. You also can apply B separately to the soil as a liquid or spray it onto trees. Do not band fertilizers containing B. Too much B may interrupt Christmas tree bud formation and growth. Excessive B rates will severely affect tree growth.
Liming materials
Liming materials are used to raise soil pH and supply Ca or Mg to the soil (Figure 49). The carbonate part of the calcium carbonate molecule neutralizes soil acidity.
The quality of a liming material is related to its chemical composition, particle size (degree of fineness), and moisture content. All liming materials sold in Oregon must have a lime score. Lime score is a numerical expression of lime quality that provides a method for comparing liming materials. It is based on fineness, moisture content, and acid-neutralizing value or calcium carbonate equivalent.
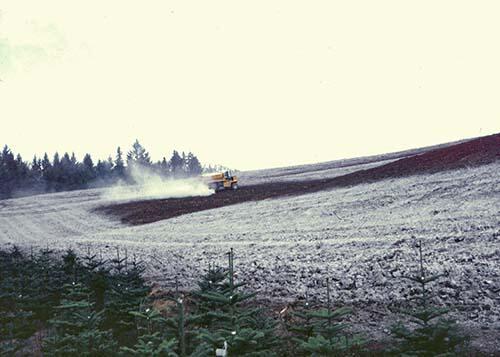
Ground limestone
Ground limestone is either calcitic or dolomitic. Calcitic lime (calcium carbonate, or CaCO3), also called agricultural lime, is the industry standard. It readily changes soil pH and is a source of Ca.
Dolomitic lime is a combination of calcium car-bonate and magnesium carbonate, CaMg(CO3)2. Dolomitic lime supplies both Ca and Mg, but changes soil pH slowly.
We do not recommend using only dolomitic lime, although this material is appropriate when both pH and Mg are low. Dolomitic lime is more expensive than calcitic lime. Also, because it is slightly less soluble than calcitic lime, it neutralizes soil acidity more slowly. See “Site preparation” to learn more about using nonmobile nutrients, including Mg. When Mg is needed during a rotation, choose a soluble source such as magnesium sulfate (Epsom salts) or potassium magnesium sulfate (K-Mag).
Most calcitic or dolomitic lime has a lime score of 80 to 110. Finely ground, dry calcitic lime has a score of 100.
Both calcitic and dolomitic lime should be applied and incorporated between rotations.
Byproduct materials
Byproduct or alternative lime materials come from manufacturing operations such as paper manufacturing. During the manufacturing process, lime is not entirely reacted and some enters the mill’s waste stream, from which it is recovered and spread on land. Another example of byproduct lime is ash from wood-burning power-generation facilities. Most by-product material is effective, safe to use, and suitable for application in Christmas tree plantations.
Unfortunately, some by-product lime contains unwanted material, including charcoal, metal contaminants and salts. Byproduct material that supplies several tons of carbon-containing material, such as wood fiber or paper, can immobilize or “tie up” N. Materials with ash or high chloride content generally are high in salt content. These contaminants can cause reduced yield, reduced efficacy of some herbicides and undesirable soil quality changes.
Byproduct lime typically has a lower lime score than traditional agricultural lime (between 10 and 80) and consequently should cost less per ton. Be sure you know what you are purchasing when using byproduct lime.
Summary
Table 28 summarizes the fertilizer materials commonly used in Christmas tree production and their analyses.
|
Fertilizer |
N |
P2O5 |
K2O |
S |
B |
|---|---|---|---|---|---|
| Urea | 46 | — | — | — | — |
| Urea-Sul | 40a | — | — | 8a | — |
| Ammonium sulfate | 21 | — | — | 24 | — |
| Calcium nitrate | 15 | — | — | — | — |
| Ammonium phosphate | 10–20 | 20–55 | — | — | — |
| Potassium chloride | — | — | 60 | — | — |
| Potassium sulfate | — | — | 50 | 18 | — |
| Magnesium sulfate | — | — | — | 25 | — |
| Potassium magnesium sulfate | — | — | 22 | 22 | — |
| Sodium borate | — | — | — | — | 10–20 |
aAnalysis varies
Appendix 3. Frequently asked questions
Why does the analytical procedure used for soil or foliar testing matter?
Analytical methods may vary greatly from lab to lab and across the country. Test results may vary, depending on the method used. Some differences are insignificant; others can substantially change results and recommendations.
Recommendations in this publication are based on soil test methods listed in Table 9. Compare the methods used by your laboratory to those in Table 9. For more information on soil test procedures, see Soil test interpretation guide, EC 1478.
Are lab results based on direct analysis or inferred from other data?
Some laboratories may estimate soil textural class (the amount of sand, silt and clay) or cation exchange capacity (CEC) from a combination of extractable K, Ca, Mg, soil pH and soil buffer pH. Ask the lab how results are determined.
Why are repeated foliar analyses important?
Repeated soil and foliar tests during rotations are important in identifying changes or trends over time. Growers generally use the same laboratory for many years. Performance over “the long haul” is desired.
Sometimes one sample does not fit past trends. The reason may be variation in sampling or in laboratory analysis. Call the laboratory if you have questions about results or recommendations. A laboratory should wish to ensure accurate results and should be willing to check results based on valid customer concerns.
How does nitrogen fertilizer affect cold hardiness and keeping ability of harvested Christmas trees?
Tests for cold hardiness are used to evaluate trees’ needle loss rate when exposed to low temperatures. Tests for keeping ability are designed to evaluate tree response following harvest. Needle shedding during display is the measurement used to evaluate how well a tree “keeps.”
Researchers at Washington State University compared needle loss from cold temperatures and during display for Douglas-fir and noble fir grown with high fertilizer rates to those receiving no fertilizer.
In trials with noble fir, N fertilization did not affect cold hardiness or needle loss during display. From these trials, we can suppose that the moderate rates of fertilization suggested in this guide will not affect these characteristics.
In trials with Douglas-fir, needle loss during display was not tested. High levels of N fertilization did decrease cold hardiness, however. The needle loss on heavily fertilized trees exposed to temperatures between 3° F and -11° F was much higher than on trees receiving no fertilizer. Below -11° F and above 3° F, fertilized and unfertilized trees experienced similar levels of needle loss. At the moderate fertilizer rates suggested in this guide, cold-induced needle losses are not expected to differ greatly between fertilized and unfertilized trees, but this assumption is untested.
My soil test results include a value for “soil organic matter.” What does this information mean?
Organic matter is an important component of soil; it provides a nutrient source for soil micro-organisms, promotes soil aggregation, and aids in water and nutrient retention.
Some plant residues are taken into the cells of microorganisms as they grow and divide; some remain as plant tars and lignin. Residues decompose, releasing carbon as CO2. After initial decomposition, residues are converted into a more stable form, which may remain in the soil for years. This stable form is “soil organic matter.”
Changing a soil’s organic matter content requires consistent, repeated additions of organic materials and minimal tillage disturbance. Current management practices do not encourage organic matter accumulation. Growers who wish to amend soils with organic material should consider the following.
- Materials should be generally free of weeds, weed seed, and diseases.
- Mulches may suppress some weed species but may encourage others by retaining surface moisture.
- To mulch 1 acre to a depth of 2 inches, 270 cubic yards of material is needed.
- Surface mulches provide shelter for tree-girdling rodents.
- Growing a green mulch between rows or between rotations does not dramatically improve soil organic matter, but it may help to reduce erosion.
There is no doubt that nutrient cycling and soil bacteria are important to tree growth. However, do not assume there is a problem simply because you have not added a particular product or amendment. In short — buyer beware.
If you are curious about the benefit of adding organic matter, evaluate the effectiveness of a product in a small trial. Don’t assume that it will provide any benefit to trees just because it works well on lawns or tomatoes.
What’s in a fertilizer?
Fertilizer grade is the amount of nutrient in a fertilizer. The grade of a fertilizer material indicates the available nutrient content expressed as percentage of N, P (P2O5) and potash (K2O), in that order. Nitrogen is expressed on an elemental basis, and phosphorus and potash are expressed as oxides, rather than elemental P and K. A fertilizer with a grade of 10-20-5 contains 10% N, 20% P2O5 and 5% K2O.
Fertilizers often contain other macronutrients, such as S and Mg, or micronutrients, such as B and Zn. These nutrients are listed on the fertilizer label on an elemental basis and sometimes are included in the fertilizer grade. A 15-15-10-8(S) fertilizer contains 15% N and P2O5, 10% K2O and 8% S.
For nutrients to be available to a plant, they need to be in a compound containing oxygen, hydrogen, and sometimes carbon. These elements are part of the total weight considered when expressing fertilizer grade. For example, urea contains 46% N. The remaining 54% of its weight is carbon, hydrogen and oxygen.
What N materials are suitable for my situation, based on material cost?
See "Appendix 2" to review the suitability of various N sources. To determine the cost per pound of a nutrient from any source, you need to know the analysis, or grade, of the material and the unit cost. The unit cost is the cost per bag, ton or gallon. For example, let’s compare the cost of N from urea and ammonium sulfate, given the following per-ton costs and analyses (Table 29).
|
|
Urea |
Ammonium sulfate |
|---|---|---|
| Grade or analysis | 46% N | 21% N |
| Cost per ton | $475 | $275 |
| Cost of N/lb | $0.52 | $0.67 |
In our example, urea costs $475 per ton. The left-hand column of Table 30 is the per-ton cost of fertilizer material in $25 increments. Find $475 in this column. The urea contains 46% N. The top row in Table 30 is fertilizer grade in 5%. The closest grade to 46% is 45%. Follow the column under 45% down until you reach the $475 row. The result is 53. This is the cost in cents per pound of N.
Repeat the process for ammonium sulfate. The cost per ton is $275. Ammonium sulfate contains 21% N; 20% is the closest number in the top row. Follow the column under 20% down until you intersect the $275 row. The result is 69, so a pound of N costs 69 cents. Keep in mind that this number is an approximation, since the exact grade is not listed in Table 30.
If you purchase fertilizer in 80-pound bags and know the cost per bag, multiply the cost by 25 to determine the cost per ton. For example, if an 80-pound bag of fertilizer costs $8, then $8 x 25 = $200. After determining the per-ton cost, use Table 30 to find the cost per pound.
Table 30 can be used for determining cost per pound of any nutrient if it is the only nutrient in the fertilizer material or if you do not assign a value for the second nutrient. For example, you can determine the cost per pound of K in 0-0-60, but not the cost per pound of P in 16-20-0-14. The example with ammonium sulfate did not assign a value to the S in the material.
|
|
Fertilizer grade (%) N |
|||||||
|---|---|---|---|---|---|---|---|---|
|
15% |
20% |
25% |
30% |
35% |
40% |
45% |
50% |
|
|
Fertilizer cost/ton ($) |
Nutrient cost/lb (cents) |
|||||||
|
250 |
83 | 63 | 50 | 42 | 36 | 31 | 28 | 25 |
|
275 |
92 | 69 | 55 | 46 | 39 | 34 | 31 | 28 |
|
300 |
100 | 75 | 60 | 50 | 43 | 38 | 33 | 30 |
|
325 |
108 | 81 | 65 | 54 | 46 | 41 | 36 | 33 |
|
350 |
117 | 88 | 70 | 58 | 50 | 44 | 39 | 35 |
|
375 |
125 | 94 | 75 | 63 | 54 | 47 | 42 | 38 |
|
400 |
133 | 100 | 80 | 67 | 57 | 50 | 44 | 40 |
|
425 |
142 | 106 | 85 | 71 | 61 | 53 | 47 | 43 |
|
450 |
150 | 113 | 90 | 75 | 64 | 56 | 50 | 45 |
|
475 |
158 | 119 | 95 | 79 | 68 | 59 | 53 | 48 |
|
500 |
167 | 125 | 100 | 83 | 71 | 63 | 56 | 50 |
|
525 |
176 | 131 | 105 | 88 | 75 | 66 | 58 | 53 |
|
550 |
183 | 138 | 110 | 92 | 79 | 69 | 61 | 55 |
|
575 |
192 | 144 | 115 | 96 | 82 | 72 | 64 | 58 |
|
600 |
200 | 150 | 120 | 100 | 86 | 75 | 67 | 60 |
Appendix 4. Nutrients in Christmas trees
|
Tree height |
||||
|---|---|---|---|---|
|
2–3 ft |
4–5 ft |
6–7 ft |
8–9 ft |
|
|
Tree part |
Nutrient uptake (lb/a) |
|||
|
Douglas-fir |
||||
| Needles and small branches | 13 | 110 | 173 | 266 |
| Trunk and large branches | 1 | 7 | 10 | 18 |
| Roots | * | 7 | 9 | 15 |
| Tree total | * | 128 | 192 | 299 |
|
Noble fir |
||||
| Needles and small branches | 26 | 68 | 279 | 379 |
| Trunk and large branches | 2 | 6 | 22 | 43 |
| Roots | 4 | 13 | 55 | 61 |
| Tree total | 32 | 87 | 356 | 483 |
|
Grand fir |
||||
| Needles and small branches | 19 | 82 | 182 | 310 |
| Trunk and large branches | 1 | 4 | 9 | 18 |
| Roots | 4 | 16 | 35 | 49 |
| Tree total | 24 | 102 | 227 | 377 |
|
Nordmann fir |
||||
| Needles and small branches | 21 | 132 | 219 | 471 |
| Trunk and large branches | 2 | 15 | 15 | 35 |
| Roots | 7 | 20 | 31 | 61 |
| Tree total | 30 | 167 | 265 | 567 |
*No data or less than 1 lb
|
Tree height |
||||
|---|---|---|---|---|
|
2–3 ft |
4–5 ft |
6–7 ft |
8–9 ft |
|
|
Tree part |
Nutrient uptake (lb/a) |
|||
|
Douglas-fir |
||||
| Needles and small branches | 4 | 37 | 58 | 88 |
| Trunk and large branches | 1 | 4 | 5 | 9 |
| Roots | * | 4 | 5 | 8 |
| Tree total | * | 45 | 68 | 105 |
|
Noble fir |
||||
| Needles and small branches | 11 | 29 | 118 | 171 |
| Trunk and large branches | 2 | 6 | 22 | 43 |
| Roots | 5 | 16 | 64 | 74 |
| Tree total | 18 | 51 | 204 | 288 |
|
Grand fir |
||||
| Needles and small branches | 9 | 40 | 92 | 156 |
| Trunk and large branches | 1 | 3 | 7 | 14 |
| Roots | 3 | 10 | 25 | 34 |
| Tree total | 13 | 53 | 124 | 204 |
|
Nordmann fir |
||||
| Needles and small branches | 9 | 47 | 84 | 183 |
| Trunk and large branches | 1 | 9 | 9 | 23 |
| Roots | 7 | 18 | 30 | 59 |
| Tree total | 17 | 74 | 123 | 265 |
*No data or less than 1 lb
|
Tree height |
||||
|---|---|---|---|---|
|
2–3 ft |
4–5 ft |
6–7 ft |
8–9 ft |
|
|
Tree part |
Nutrient uptake (lb/a) |
|||
|
Douglas-fir |
||||
| Needles and small branches | 1 | 9 | 13 | 20 |
| Trunk and large branches | * | 1 | 1 | 2 |
| Roots | * | 1 | 1 | 2 |
| Tree total | * | 11 | 15 | 24 |
|
Noble fir |
||||
| Needles and small branches | 3 | 6 | 27 | 39 |
| Trunk and large branches | * | 1 | 4 | 8 |
| Roots | 1 | 2 | 9 | 10 |
| Tree total | * | 9 | 40 | 57 |
|
Grand fir |
||||
| Needles and small branches | 1 | 7 | 15 | 25 |
| Trunk and large branches | * | 1 | 1 | 2 |
| Roots | * | 1 | 3 | 4 |
| Tree total | * | 9 | 19 | 31 |
|
Nordmann fir |
||||
| Needles and small branches | 2 | 13 | 23 | 49 |
| Trunk and large branches | * | 2 | 1 | 5 |
| Roots | 1 | 3 | 5 | 10 |
| Tree total | * | 18 | 29 | 64 |
*No data or less than 1 lb
|
Tree height |
||||
|---|---|---|---|---|
|
2–3 ft |
4–5 ft |
6–7 ft |
8–9 ft |
|
|
Tree part |
Nutrient uptake (lb/a) |
|||
|
Douglas-fir |
~ |
|||
| Needles and small branches | 6 | 47 | 73 | 111 |
| Trunk and large branches | 1 | 4 | 6 | 11 |
| Roots | * | 4 | 5 | 9 |
| Tree total | * | 55 | 84 | 131 |
|
Noble fir |
||||
| Needles and small branches | 13 | 34 | 139 | 189 |
| Trunk and large branches | 1 | 4 | 15 | 28 |
| Roots | 3 | 8 | 34 | 38 |
| Tree total | 17 | 46 | 188 | 255 |
|
Grand fir |
||||
| Needles and small branches | 13 | 56 | 125 | 213 |
| Trunk and large branches | 1 | 5 | 12 | 22 |
| Roots | 3 | 10 | 25 | 23 |
| Tree total | 17 | 71 | 162 | 268 |
|
Nordmann fir |
||||
| Needles and small branches | 16 | 85 | 161 | 350 |
| Trunk and large branches | 2 | 13 | 13 | 30 |
| Roots | 4 | 12 | 18 | 36 |
| Tree total | 22 | 110 | 192 | 416 |
*No data or less than 1 lb
|
Tree height |
||||
|---|---|---|---|---|
|
2–3 ft |
4–5 ft |
6–7 ft |
8–9 ft |
|
|
Tree part |
Nutrient uptake (lb/a) |
|||
|
Douglas-fir |
||||
| Needles and small branches | 1 | 10 | 15 | 23 |
| Trunk and large branches | * | 1 | 1 | 2 |
| Roots | * | 1 | 1 | 2 |
| Tree total | * | 12 | 17 | 27 |
|
Noble fir |
||||
| Needles and small branches | 2 | 6 | 25 | 36 |
| Trunk and large branches | * | 1 | 3 | 7 |
| Roots | 1 | 3 | 10 | 12 |
| Tree total | 3 | 10 | 38 | 55 |
|
Grand fir |
||||
| Needles and small branches | 2 | 8 | 18 | 29 |
| Trunk and large branches | * | 1 | 1 | 3 |
| Roots | * | 2 | 4 | 6 |
| Tree total | 3 | 11 | 23 | 38 |
|
Nordmann fir |
||||
| Needles and small branches | 2 | 10 | 17 | 36 |
| Trunk and large branches | * | 1 | 1 | 3 |
| Roots | 1 | 2 | 3 | 6 |
| Tree total | 3 | 13 | 21 | 45 |
*No data or less than 1 lb
|
Tree height |
||||
|---|---|---|---|---|
|
2–3 ft |
4–5 ft |
6–7 ft |
8–9 ft |
|
|
Tree part |
Nutrient uptake (lb/a) |
|||
|
Douglas-fir |
||||
| Needles and small branches | 1 | 6 | 9 | 14 |
| Trunk and large branches | * | 1 | 1 | 1 |
| Roots | * | 1 | 1 | 2 |
| Tree total | * | 8 | 11 | 17 |
|
Noble fir |
||||
| Needles and small branches | 1 | 4 | 16 | 21 |
| Trunk and large branches | * | 1 | 2 | 4 |
| Roots | 1 | 2 | 6 | 7 |
| Tree total | 2 | 7 | 24 | 32 |
|
Grand fir |
||||
| Needles and small branches | 1 | 5 | 12 | 20 |
| Trunk and large branches | * | 0 | 1 | 2 |
| Roots | * | 1 | 3 | 3 |
| Tree total | 1 | 6 | 16 | 25 |
|
Nordmann fir |
||||
| Needles and small branches | 1 | 8 | 13 | 28 |
| Trunk and large branches | * | 1 | 1 | 3 |
| Roots | 1 | 2 | 3 | 6 |
| Tree total | 2 | 11 | 17 | 37 |
*No data or less than 1 lb
Appendix 5. Needle nutrient concentration and whorl position
In Denmark, needle samples are taken from the top whorl. We were curious whether a physiological or management reason existed for this procedure. To examine needle nutrient concentration difference by whorl, we sampled the top three whorls of noble fir Christmas trees for three years.
Differences existed in whorl nutrient concentration, similar to differences between the top and bottom halves of the tree. Comparison of needle nutrient concentration by whorl position was not straightforward, however (Tables 37 and 38).
Concentration of Ca, K, S and B showed a clear pattern with respect to whorl position. K, S and B concentration increased with whorl height, and Ca concentration decreased with height. Other elements sometimes varied with whorl position and sometimes did not.
Although nutrient concentration differed by whorl, no pattern emerged that provided a reason for sampling one whorl compared to another. We recommend sampling the upper one-third of the tree, obtaining a similar number of needles from each whorl.
One caution: You probably will see a slight change in nutrient concentration results if you have been sampling only one whorl and change to sampling several whorls from the upper one-third of the tree.
|
Treatment |
No difference |
Increase with height |
Decrease with height |
Different with no pattern |
|---|---|---|---|---|
| Control | N, P, Cu, Mn | K, S, B | Ca, Mg | Zn |
| Potassium, magnesium | N, P, Cu, Zn | K, S, B | Ca, Mg | Mn |
| Nitrogen, sulfur | Mg, Mn, Cu | P, K, S, Zn, B | Ca, N | |
|
Treatment |
Position |
N (%) |
P (%) |
K (%) |
S (%) |
Ca (%) |
Mg (%) |
Cu (ppm) |
B (ppm) |
Mn (ppm) |
Zn (ppm) |
|---|---|---|---|---|---|---|---|---|---|---|---|
| Control | Uppermost | 1.22 | 0.15 | 0.96 | 0.11 | 0.35 | 0.09 | 4 | 40 | 269 | 43 |
| Second | 1.28 | 0.15 | 0.78 | 0.08 | 0.39 | 0.09 | 4 | 32 | 258 | 34 | |
| Third | 1.24 | 0.15 | 0.69 | 0.08 | 0.51 | 0.11 | 4 | 28 | 297 | 46 | |
| LSD = 0.05a | ND | ND | 0.06 | 0.02 | 0.04 | 0.01 | ND | 7 | ND | 5 | |
| K-magb | Uppermost | 1.11 | 0.17 | 1.20 | 0.13 | 0.29 | 0.09 | 4 | 44 | 342 | 36 |
| Second | 1.11 | 0.17 | 0.98 | 0.10 | 0.33 | 0.09 | 3 | 34 | 321 | 31 | |
| Third | 1.11 | 0.16 | 0.89 | 0.09 | 0.40 | 0.10 | 3 | 30 | 368 | 35 | |
| LSD = 0.05a | ND | ND | 0.24 | 0.02 | 0.03 | 0.008 | ND | 3.5 | 33 | ND | |
| Urea-sulc | Uppermost | 1.51 | 0.14 | 0.90 | 0.14 | 0.31 | 0.15 | 4 | 32 | 446 | 38 |
| Second | 1.63 | 0.14 | 0.68 | 0.08 | 0.37 | 0.07 | 4 | 28 | 521 | 33 | |
| Third | 1.63 | 0.13 | 0.58 | 0.07 | 0.45 | 0.08 | 4 | 22 | 589 | 31 | |
| LSD = 0.05a | 0.01 | 0.005 | 0.054 | 0.04 | 0.057 | ND | ND | 7 | ND | 6.9 |
aND is no difference p = 0.05 from ANOVA. For example, N concentration of 1.22 and 1.28 percent for the control treat-ment were not different, but the N difference in concentration of 1.51 and 1.63 for the Urea-sul treatments is 0.1 percent (greater than 0.01 percent), so the N concentration in the uppermost whorl was lower than that in the second or third whorl.
bThe K-Mag treatments received 92 lb S/a, 92 lb K2O/a, and 46 lb MgO/a.
cThe Urea-sul treatments received 225 lb N/a and 32 lb S/a.
Summary and quick reference
Nutrient management for Christmas trees can be divided into five stages: site preparation, seedling establishment and early rotation, mid-rotation, late rotation and postharvest. Tables S1–S7 summarize monitoring and field activities based on plantation age and height. Nutrient management for each of these stages is discussed in their respective sections.
Cost-effective and environmentally responsible nutrient management begins with soil analysis and applications of P, K, Mg and lime prior to tree planting. During the rotation, monitor nutrients in tree foliage annually, and decide whether additional nutrients will improve tree growth or color for a reasonable cost. Also, consider potential environmental impacts such as leaching of N into water sources.
Preplant summary
|
Nutrient |
Test value |
Rate |
Comments |
|---|---|---|---|
|
Phosphorus (P) |
0–10 ppm | 180 lb P2O5/acre | Bray |
| 11–15 ppm | 90 lb P2O5/acre | ||
| above 15 ppm | Adequate; monitor foliar P | ||
|
Potassium (K) |
below 75 ppm | 100–200 lb K2O/acre | Ammonium acetate extractable |
| above 75 ppm | Adequate; monitor foliar K | Ammonium acetate extractable | |
|
Soil pH |
pH below 5.0 | Add lime according to SMP buffer test (Table 6) | See 'Magnesium' to determine whether dolomitic lime is needed |
| pH 5.0–5.6 | Consider adding 1–1.5 ton lime/acre | See 'Magnesium' to determine whether dolomitic lime is needed | |
| pH above 5.6 | No lime needed | ||
|
Calcium (Ca) |
soil Ca below 5 meq/100 g soil and pH below 5.0 | Add lime as indicated by SMP buffer test | Ammonium acetate extractable; see 'Magnesium' to determine whether dolomitic lime is needed |
| soil Ca below 5 meq/100 g soil and pH between 5.0 and 5.5 | 1 ton lime/acre | See 'Magnesium' to determine whether dolomitic lime is needed | |
| soil Ca above 5 meq/100 g soil and pH above 5.5 | Monitor foliar Ca and Mg | ||
|
Magnesium (Mg) |
soil Mg below 0.4 meq/100 g soil and pH below 5.5 | Add 1 ton dolomitic lime/acre | Ammonium acetate extractable |
| soil Mg below 0.4 meq/100 g soil and pH above 5.5 | Apply 100–200 lb Mg/acre | Supply Mg as K-Mag or Epsom salts |
aRecommendations are based on the listed lab test methods. Bray and ammonium acetate refer to methods used for soil analysis. Recommendations are designed for a soil sample from the soil surface to a depth of 6 or 8 inches.
|
SMP buffer |
Lime needed to raise pH of surface 6 inches of soil to 5.6 (ton/acre) |
|---|---|
| 4.8–5.0 | 5–6 |
| 5.1–5.3 | 4–5 |
| 5.4–5.6 | 3–4 |
| 5.7–5.9 | 2–3 |
| 6.0–6.2 | 1–2 |
| above 6.2 | 0 |
Lime recommendation is based on 100-score lime. Lime score represents the effectiveness of the liming reaction, regardless of lime source. See "Appendix 2" for an explanation of lime score and liming materials.
Mid-rotation summary
The minimum nutrient management recommended for Christmas trees that are growing as desired and have sufficient color is a needle analysis for N two years before harvest for noble fir and a year before harvest for Douglas-fir. If Douglas-fir needle N is below 1.6% or if noble fir needle N is below 1.4%, apply N according to Table S3.
|
Nutrient |
Douglas-fir |
Noble fir |
|---|---|---|
|
Macronutrient |
||
| Calcium (Ca) | 0.25% | 0.25% |
| Magnesium (Mg) | 0.07% | 0.07% |
| Nitrogen (N) | 1.60% | 1.40% |
| Phosphorus (P) | 0.15% | 0.15% |
| Potassium (K) | 0.60% | 0.60% |
| Sulfur (S) | 0.06% | 0.06% |
|
Micronutrient |
||
| Boron (B) | 15 ppm | 15 ppm |
| Copper (Cu) | 3 ppm | 3 ppm |
| Iron (Fe) | unknown | unknown |
| Manganese (Mn) | 25 ppm | 25 ppm |
| Zinc (Zn) | 10 ppm | 10 ppm |
|
Species |
N foliar analysis (%) |
Broadcast rate (lb N/acre) |
Individual tree rate (oz N/tree)a |
|---|---|---|---|
|
Douglas-fir |
below 1.2 | 150 | 2–3 |
| 1.2–1.6 | 100 | 1–2 | |
| above 1.6 | 0 | 0 | |
|
Noble fir |
below 1.1 | 150 | 2–3 |
| 1.1–1.4 | 100 | 1–2 | |
| above 1.4 | 0 | 0 |
aChoose-and-cut growers can use tree height to gauge N rate. Apply 1 oz of urea or 2 oz of a fertilizer with approximately 20 percent N per foot of tree height.
|
P foliar analysis (%) |
Rate (lb P2O5/acre) |
|---|---|
| below 0.08 | 180 |
| 0.08–0.15 | 90 |
| above 0.15 | 0 |
Begin foliar analysis in February of the third growing season after planting. Reanalyze every other year to deter-mine whether deficiencies have been corrected.
|
K foliar analysis (%) |
Rate (lb K2O/acre) |
|---|---|
| below 0.4 | 100 |
| 0.4 to 0.6 | 50 |
| 0.6 to 0.8 |
soil test K above 75 ppm — 0 soil test K below 75 ppm — 50 |
Begin foliar analysis in February of the third growing season after planting. Reanalyze every other year to deter-mine whether deficiencies have been corrected.
|
Nutrient |
Foliar nutrient concentration below which nutrients may be needed (ppm) |
Comments |
|---|---|---|
| Boron (B) | 15 | Broadcast 3 lb B/acre. Can be toxic if banded or overapplied. |
| Zinc (Zn) | 10 | Generally is not deficient in acid soils of western Oregon and Washington. |
| Manganese (Mn) | 25 | Generally is not deficient in acid soils of western Oregon and Washington. Monitor to indicate soil pH decline. |
| Copper (Cu) | 3 | Generally is not deficient in acid soils of western Oregon and Washington. |
| Iron (Fe) | uncertain | Foliar analysis is unreliable and not recommended. |
Begin foliar analysis in February of the third growing season after planting. Reanalyze every other year to determine whether deficiencies have been corrected.
Custom blending of fertilizers to supply micronutrients and other fertilizers is common in the fertilizer supply industry. Consult a fertilizer dealer or other professional regarding application rates and methods of applying micronutrients.
For more information
OSU Extension Service publications
Estimating plant-available nitrogen from manure, EM 8954
Fertilizer and lime materials, FG 52
Fertilizing with biosolids, PNW 508
Growing Christmas trees in the Pacific Northwest, PNW 6
Get actionable results from a soil, plant or environmental testing lab, EM 8677
A guide to collecting soil samples for farms and gardens, EC 628
Soil test interpretation guide, EC 1478
OSU Organic fertilizer and cover crop calculators
Other publications
Blake, J.I., H.N. Chappell, W.S. Bennett, S.R. Webster, and S.P. Gessel. 1990. Douglas-fir growth and foliar nutrient responses to nitrogen and sulfur fertilization. Soil Sci. Soc. Am. J. 54: 257–262.
Bondi, M., C. Landgren, R. Fletcher, T. Sabin, J. Hart, and S. Webster. 1993. What’s nitrogen fertilizer buying you? Christmas Tree Lookout (Winter): 18–28.
Brewer, L., R.A. Fletcher, J.M. Hart, C.G. Landgren, M.C. Bondi, and S.R. Webster. 2002. Changes in Soil Conditions Over Multiple Christmas Tree Cropping Cycles. Final Report for the Oregon Department of Agriculture.
California Fertilizer Association. 2001. Western Fertilizer Handbook. Interstate Publishers, Inc., Danville, IL.
Chastagner, G.A., J.M. Staley, and K.L. Riley. 1990. Current season needle necrosis: A needle disorder of unknown etiology on noble and grand fir Christmas trees in the Pacific Northwest. In: W. Merrill and M.E. Ostry (eds.). Recent Research on Foliage Diseases Conference Proceedings, Carlisle, PA, May 29–June 2, 1989. USDA Forest Service General Tech. Rep. WO-56.
Chastagner, G.A and K.L. Riley. 2001. An overview of postharvest characteristics of different Abies spp. grown as Christmas trees. Christmas Tree Lookout (Summer): 18.
Cole, D.W. and S.P. Gessel. 1965. Movement of elements through a forest soil as influenced by tree removal and fertilizer additions. In C.T. Youngberg (ed.). Forest Soil Relationships in North America, pp. 95–105. Oregon State University Press, Corvallis.
Fletcher, R.A., C.G. Landgren, S.R. Webster, and M.C. Bondi. 1998. Fertilizing noble fir. Christmas Tree Lookout (Winter): 21–28.
Green, R.N. and R.E. Carter. 1993. Boron and magnesium fertilization of a coastal Douglas-fir plantation. Western Journal of Applied Forestry V8 (No. 2): 48.
Hart, J.M., L. Brewer, R.A. Fletcher, C.G. Landgren, M.C. Bondi, and S.R. Webster. 2003. Changes in needle nutrient concentration over multiple Christmas tree crop cycles. Crop & Soil News/Notes 17(5). Oregon State University Extension Service, Corvallis, OR.
Hart, J.M., R.A. Fletcher, C.G. Landgren, M.C. Bondi, and S.R. Webster. 2003. Soil and needle nutrient concentration changes over Christmas tree cropping cycles. In: Proc. 6th International Christmas Tree Research and Extension Conference, September 14–19, Hendersonville, NC.
Hart, J.M., R.A. Fletcher, C.G. Landgren, M.C. Bondi, and S.R. Webster. 2003. Changes in Needle Nutrient Concentration Over Multiple Christmas Tree Crop Cycles. Final Report for the Oregon Department of Agriculture.
Hart, J.M. 2003. Christmas trees. Crop & Soil News/Notes 17(4). Oregon State University Extension Service, Corvallis.
Hart, J.M. 2006. Christmas tree nutrient sampling. Christmas Tree Lookout (Fall): 39–40.
Hart, J.M., C.G. Landgren, R.A. Fletcher, and M.C. Bondi. 2007. To Affirm or Modify Recommended Needle Sampling Time. Final Report for the Oregon Department of Agriculture and Agricultural Research Foundation.
Hart, J.M., C.G. Landgren, R.A. Fletcher, and M.C. Bondi. Seasonal change in noble fir, Douglas-fir, grand fir, Turkish fir, and Nordmann fir needle nutrient concentration. In: Proc. 8th International Christmas Tree Research and Extension Conference, August 2007, Bogense, Denmark.
Hart, J.M., C.G. Landgren, and J. O’Donnell. 2007. Evaluating Christmas tree nutrient needs. American Christmas Tree Journal 51(4): 14–15.
Hart, J.M., C.G. Landgren, R.A. Fletcher, and M.C. Bondi. 2007. Winter is the new season for needle sampling. Christmas Tree Lookout (2007): 23–26.
Heilman, P., T.H. Dao, H.H. Cheng, S.R. Webster, and L. Christenson. 1982. Comparison of fall and spring applications of N-15 labeled urea to Douglas-fir: 1. Growth response and nitrogen levels in foliage and soil. Soil Sci. Soc. America J. 46: 1293–1299.
Heilman, P., T.H. Dao, H.H. Cheng, S.R. Webster, and S.S. Harper. 1982. Comparison of fall and spring applications of N-15 labeled urea to Douglas-fir: 2. Fertilizer nitrogen recovery in trees and soil after 2 years. Soil Sci. Soc. America J. 46: 1300–1304.
Kaus, A. and A. Wild. 1998. Nutrient disturbance through manganese accumulation in Douglas fir. Chemosphere 36(4–5): 961–964.
McEvoy, T.J. 1992. Using Fertilizers in the Culture of Christmas Trees. Paragon Books, Richmond, VT.
McLean, E.O. 1982. Soil pH and lime requirement. In A.L. Page, R.H. Miller, and D.R. Keeney (eds.). Methods of Soil Analysis, Part 2, pp. 199–223. Agron. Monogr. 9, Am. Soc. Agron., Madison, WI.
Slesak, R.A., and R.D. Briggs. 2007. Christmas tree response to N fertilization and the development of critical foliar N levels in New York. North. J. Appl. For. 24(3): 209–217.
Steinbrenner, E.C. 1981. Growth response of young Douglas-fir to repeated applications of nitrogen and phosphorus. Soil Sci. Soc. Am. J. 45: 953–955.
Turner, D.O. 1966. Color and growth of Douglas-fir Christmas trees as affected by fertilizer application. Soil Sci. Soc. Amer. Proc. 30(6): 792–795.
Walker, R.B. and S.P. Gessel. 1991. Mineral Deficiencies of Coastal Northwest Conifers. Institute of Forest Resources Contribution 70, College of Forest Resources, University of Washington, Seattle.
Webster, S., C. Landgren, R. Fletcher, and M. Bondi. 1997. Nitrogen fertilizer: Where does it go? Christmas Tree Lookout (Summer): 26–30.
Acknowledgments
We thank the following reviewers for their thoughtful advice and assistance during preparation of this publication.
- Paul Borgen, Pratum Co-op
- Gary Elder, Noble Mountain Tree Farm
- Doug Grott, Wilbur-Ellis Company
- Donald Horneck, Oregon State University Extension Service, Umatilla County
- Larry Lutcher, Oregon State University Extension
- Service, Morrow County
- Bob Schaefer, Noble Mountain Tree Farm
- Dave Silen, Holiday Tree Farm
- Ira Zipperer, Crop Production Services
We thank the following for their contribution of data to the needle sampling section of this publication.
- Dan Barney, Extension horticulturist, University of Idaho, Sandpoint Research and Extension Center supplied data for grand fir.
- Lars Bo Pederson, senior researcher, Department of Applied Ecology at the Danish Forest and Landscape Institute, Hoersholm, University of Copenhagen, supplied data for Nordmann fir.
- Robert Stevens, director, Washington State University-Prosser (IAREC) and Extension soil specialist, provided a critical review of the needle sampling section of this publication.
About the authors

