Summary
Improper irrigation water management can lead to runoff and leaching of contaminants (pesticides, sediment, bacteria or nutrients) that impair ground and surface water. Understanding the quality of your irrigation water and how irrigation practices influence contaminant movement can reduce impairments to soil structure, improve infiltration, reduce maintenance of your irrigation system and increase crop yields. Knowing how to prevent irrigation-related water quality issues will mitigate environmental impacts and help you comply with state and federal laws.
What is a watershed?
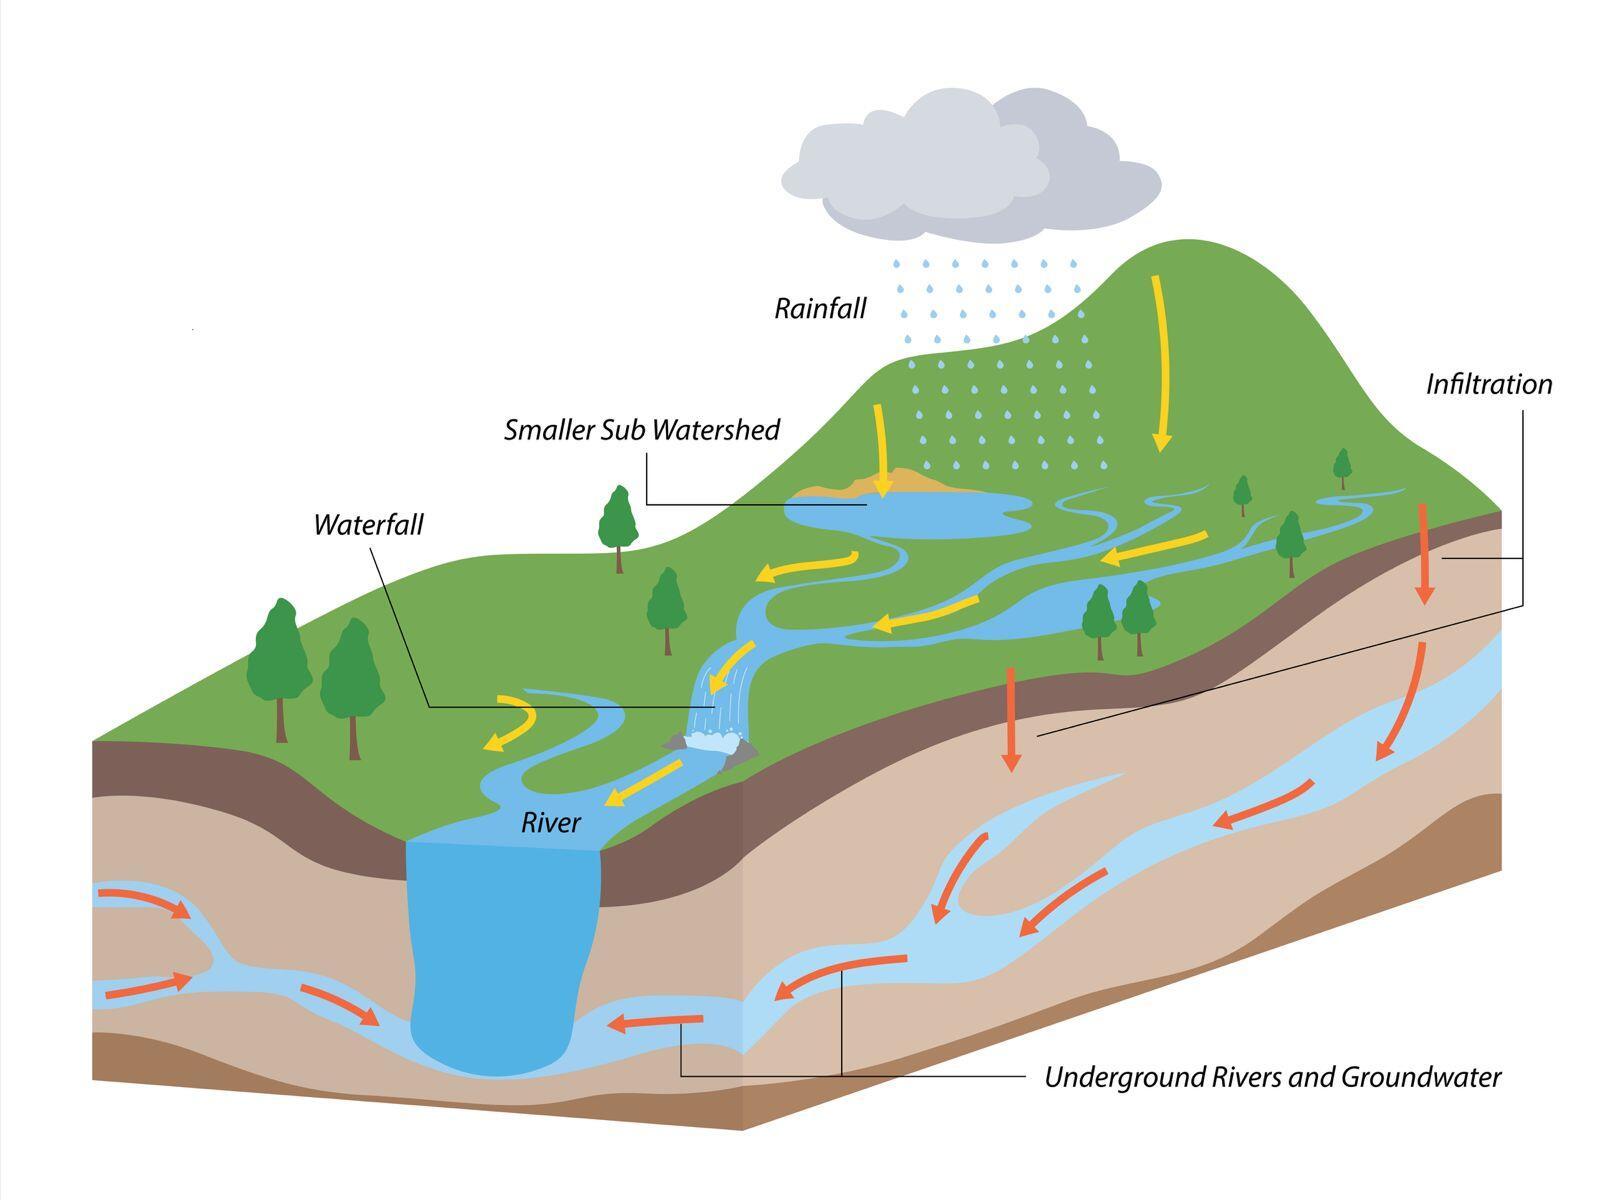
To be a good irrigator we need to know how water flows on and off our property and how it affects the watershed. A watershed is an area of land that drains all the streams and rainfall to a common outlet such as a lake, river, stream or mouth of a bay. Watersheds can be small, such as the surrounding area where you live, or large, encompassing all lands where water drains into a river or an ocean (Figure 1). Watersheds consist of both surface water, which includes rivers, streams, canals, lakes, ponds and wetlands, and groundwater, which is water that exists beneath the land surface in saturated zones (aquifers). Watersheds are important because the water quality of a stream or river can be affected by irrigation activities upstream.
Watersheds are important because the water quality of a stream or river can be affected by irrigation activities upstream.
Irrigation return flows are portions of applied irrigation water that are not taken up by crops and instead leave the field as surface runoff or move below the root zone into groundwater. These return flows are a normal part of irrigated systems, but they can transport sediment, nutrients, pesticides and bacteria if irrigation is not well managed.
The terms upstream and downstream refer to your property’s location in a watershed. Upstream land lies higher in a watershed and drains to downstream properties. Upstream actions, such as overirrigating, can transport sediment, nutrients and pesticides off your property and onto neighboring lands or nearby surface waters degrading soil quality and crop yield and impairing aquatic habitat. It can also leach nutrients and pesticides into the groundwater degrading the aquifer and contaminating the drinking water, which negatively impacts human health.
Environmental contaminants
Environmental contaminants are any physical, chemical or biological substances that are either not normally present in the environment or occur at higher concentrations than are typically found in the environment. Contaminants can have negative effects on the environment, living organisms, crops and soils.
While contaminants are usually associated with harmful substances, even beneficial nutrients, such as nitrogen and phosphorus, can become contaminants in high concentrations. Different contaminant classes include microbial ( bacteria and viruses), organic chemicals (such as pesticides), inorganic chemicals (heavy metals and nutrients), physical (such as sediment) and minerals.
Irrigation water from surface water sources will typically have different contaminant concerns than groundwater sources. Surface water generally has more issues with physical contaminants, like sediment from soil erosion. This can clog intake screens, sprinkler heads or emitters, and exact wear on pump impellers. Inorganic and organic chemicals are also a concern when using surface waters. Runoff from fields containing fertilizer or pesticides can lead to water contamination that harms aquatic habitat.
Groundwater can have issues with alkalinity and minerals such as boron, carbonates, sodium and selenium. These affect crop yields, soil structure and irrigation equipment. In addition, high concentrations of nitrates or phosphorous in groundwater can be a concern, causing negative impacts to drinking water and crop health.
Groundwater management areas
Groundwater management areas are designated by the Oregon Department of Environmental Quality when nitrate levels in a region’s groundwater are above a threshold concentration. There are three groundwater management areas in Oregon: Southern Willamette Valley, Lower Umatilla and Northern Malheur. High levels of nitrates in water can have human health effects, particularly for infants. If you live or farm in a groundwater management area, you may be contacted for well water testing and be encouraged to use agricultural practices that reduce the potential of nitrate leaching. If you have a domestic well located in a groundwater management area, you may qualify for free well testing to determine your well’s health risk.
To find out more about groundwater management areas, visit the Department of Environmental Quality.
To learn more about recommended tests and how to get your well water analyzed, see the Oregon State University Well Water Program.
Testing your irrigation water
It is much easier and more cost-effective to treat poor-quality irrigation water than remediating after problems occur. However, sometimes the water quality is too poor to realistically treat the water to usable levels for crop production. The biggest risks are an accumulation of pollutants in your soil and degradation of soil quality. Consider analyzing the quality of your irrigation water and weigh the feasibility of treatment prior to using it. Testing your irrigation water provides a baseline for making management decisions. Irrigation water should be tested for:
- pH
- Sodium
- Chloride
- Boron
- Alkalinity
- Carbonates
- Nitrate-N and ammonium-N
- Phosphorus
- Magnesium
- Calcium
- Sulfate
- Manganese
- Iron
- Copper
- Zinc
- Molybdenum
Table 1 shows the severity range of each element and strategies for managing the problem.
Nitrate in irrigation water is rarely a quality problem for plants; however, it can be a human health concern in drinking water and cause algae blooms in waters receiving irrigation runoff. To avoid leaching excess nitrates to groundwater, it is good practice to account for any nitrate within your irrigation water.
When determining how much nitrogen fertilizer to apply, use the rule of thumb: 1 inch of irrigation water with a nitrate concentration of 1 part per million nitrate as N equals 0.23 pounds of nitrogen per acre to your crop.
Other nutrients, such as phosphorous, potassium, sulfur and calcium, should also be considered when making management decisions.
To find out more about water quality sampling and testing, visit your local water quality testing laboratory or Extension or Department of Environmental Quality office.
|
Component |
Origin |
Not a problem |
Increasing problem |
Severe problem |
Issue |
Management |
|---|---|---|---|---|---|---|
|
Phosphate (PO43--P) ppm |
Ground and surface waters, fertilizers, landscape runoff and treated sewage | < 1.2 | 1.2-2.4 | > 2.4 | Runoff to water bodies can cause algal blooms, followed by a decrease in dissolved oxygen, ultimately resulting in less aquatic life. | Reverse osmosis. Fertilizer amounts and scheduling should account for amount contributed by irrigation water. |
|
Potassium (K+) ppm |
Dissolved rock, salts, soil and fertilizers | < 20 ppm | 20–50 | > 50 for foliar† | Increase K in plant tissues can lead to limited plant uptake of other required nutrients. | Distillation, reverse osmosis or ion exchange methods. |
|
Calcium (Ca2+) ppm |
Dissolved rock, limestone, gypsum, salts, soil and fertilizers |
< 20 < 60 |
25–250 60–80 |
> 250 soil and water ion hazard > 100 foliar injury† |
Binds with CO32- and HCO3- to form lime deposits; contributes to “hard water” and salinity. | Water softeners are most commonly used. Can use other ion exchange methods. |
|
Magnesium (Mg2+) ppm |
Dissolved rock, limestone, dolomite, salts, soil and fertilizers | < 25 ppm | 25–35 | > 35 | Binds with CO32- and HCO3- to form lime deposits; contributes to “hard water” and salinity. | Water softeners and ion exchange methods. |
|
Zinc (Zn) ppm |
Occurs naturally in small amounts. May result from industrial pollution. | < 2.0 ppm | > 2.0 | Not usually a problem. Can give water a milky appearance. Zinc released from corrosion of plumbing systems (copper-zinc alloys) with low pH water. |
Source dependent: • Reverse osmosis. • Other ion exchange methods. • Distillation. Increase pH of water using sodium carbonate (soda ash). |
|
|
Copper (Cu) ppm |
Occurs naturally in small amounts. Also from mining operations, acidic water and from corroding copper pipes. | < 0.2 ppm | 0.2–5.0 | > 5.0 | Not usually a problem. Staining and corrosion possible (see Zn). Toxicity in some plants at concentrations greater than 1.0 ppm. | Increase pH using sodium carbonate. |
|
Manganese (Mn2+) ppm |
Dissolved from shale and sandstone. Present in flooded soils and wetlands with low dissolved oxygen. | < 0.2 ppm | > 0.2 |
Not usually a problem. Excessive Mn: • Turns water grayish/black. • Can coat leaf surfaces and subsequently reduce photosynthesis. |
Precipitation then filtration. At low concentrations, use a water softener. Keep soil pH between 6.0 and 7.0, with good drainage. | |
|
Iron (Fe2+ or Fe3+) ppm |
Iron is dissolved from underlying rocks and soil. Can be present if low-pH water passes through iron pipes or equipment. | < 0.3 ppm | 0.3–5 | > 5 | Rust forms in the presence of oxygen (in water or air). If salt is present, metal will rust faster. Rust causes reddish-brown staining. Flake off can clog nozzles, filters and lines. Iron complexes with organic materials and bacteria, causing slimes. If Fe is greater than 5 ppm, coatings form on leaf surfaces. This may reduce photosynthesis. |
Iron treatment depends on the type of problem. Common techniques include: • Aeration then sediment filtration. • Sediment filtration then a water softener. (Caution: these usually use sodium.) • Precipitation with potassium permanganate, then sediment filtration. • Chlorination then sediment and carbon filtration. |
|
Sulfur (S) ppm |
Rock and soil containing gypsum, iron sulfides, other sulfur compounds. Industrial wastes, sewage and coal mining operations. | < 33 ppm | 33–66 | > 66 | If calcium is present, scale can form. As part of salinity, can reduce growth or cause plant injury. | Reverse osmosis. |
|
Boron (B) ppm |
Naturally occurring in groundwater and from decaying plant material. Industrial pollutants and from agricultural runoff also are sources. | < 1.0 ppm | 1.0–2.0 | > 2.0 | Needed in very small amounts by plants. When in excess, it is toxic. Plant sensitivity ranges. | Boron leaches quickly from sandy soils; not typically a problem. Will accumulate in fine-textured soils and pose a greater toxicity threat to sensitive plants. |
|
Sodium (Na+) ppm |
Dissolved from rock, salts and soil. Human-induced concentrations from road salt, fertilizers, industrial brines and reclaimed wastewater. |
< 70 ppm < 70 |
70–200 |
>200 for soil and water ion hazard > 70 for foliar injury‡ |
High concentrations can speed up corrosion by other elements. Can also burn foliage. Refer to SAR in this table. | See SAR in this table. |
|
Chloride (Cl |
From dissolved minerals and seawater. Human-induced concentrations from road salt, fertilizers, industrial wastes and sewage. |
< 70 ppm 0 |
70–300 0–100∫ |
> 300 for soil & water ion hazard > 100 for foliar injury† |
Mobile in the soil. Cl can be taken up by roots and accumulate in leaves, causing toxicity. | Blend or change to an alternative water source. Reverse osmosis. |
|
Nitrate (NO3--N) ppm |
From decaying organic material. Major contributions from fertilizers, sewage and manure applications. | < 50 | 50–100 | > 100 | High concentrations: succulent plant growth, tissues not as resource efficient and plants more susceptible to some pests. Nitrogen-rich runoff can cause excessive nutrients in receiving waters. | Fertilization amounts and scheduling should account for amount supplied by irrigation water. Reverse osmosis. |
|
Total dissolved salts (TDS) ppm |
Concentration of mineral salts (for example, MgSO4, MgCl, CaCl, NaHCO3, NaCl, KCl) dissolved in water. Refer to electrical conductivity in this table. | < 500 | 500–2000 | > 2000 | The same as total dissolved solids in clear, nonturbid water. High salinity — salt accumulation in fine-textured soils; hard for roots to absorb water. Determine if sodium-dominant. | See electrical conductivity, permeability and residual sodium chloride in the next section. |
|
Electrical conductivity (EC) mmhos/cm |
Indicator of presence of mineral salts, which originate from the earth’s crust. Salts contributed by fertilizers, organic matter and treated wastewater. | 0.50–0.75 | 0.75–3.0 | < 0.50 or > 3.0 | Use EC as the initial indicator that a problem exists. Further evaluation is needed to determine if the problem is total dissolved salts, sodium, or HCO3- and CO32-. | Management depends on the type and degree of the problem. Refer to water permeability in the next section. |
|
pH |
Measure of hydrogen ion (H+) concentration. Logarithmic scale 1–14: 1 = acidic. 7 = neutral. 14 = alkaline. Water pH fluctuates diurnally & seasonally. |
Normal range: 6.5–8.0 |
< 6.0 or > 8.0 |
Regulates plant nutrient and soil elements availability. Indicates a problem exists, continue to evaluate. Alkaline water: high in CO32- and HCO3- and salinity. pH <5.5 or >8.5 can cause corrosion of pipes and equipment. |
Inject an acid or base into the irrigation water. | |
|
Bicarbonate (HCO3-) meq/L |
Dissolution of limestone and dolomite. Also from atmospheric carbon dioxide. | < 1.5 <1.5 | 1.5–3.0 1.5–8.5 | > 3.0 for soil and water ion hazard > 8.5 for foliar‡ | Deposits (milky spots) form when reacting with Ca2+ & Mg2+ to form insoluble precipitates. | Inject acid into irrigation water to lower the pH. |
|
Carbonate (CO3 2-) meq/L |
Refer to bicarbonate (HCO3-) | < 0.5 meq/L | 0.5–1.65 | > 1.65 | Deposits (milky spots) form when reacting with Ca2+ & Mg2+ to form insoluble precipitates. | Inject acid into irrigation water to lower the pH. |
|
Sodium absorption ratio (SAR) or Adjusted residual sodium (Adj RNa) meq/L |
Sodium hazard measured by comparing the concentration of sodium to that of calcium and magnesium. | < 10 meq/L* | 10–18 | > 18 |
High sodium hazard: • Sodium is disproportionately abundant. • Soils may disperse, reducing porosity. • Salt crust may reduce infiltration. • Harder for roots to absorb water. Fine-textured soils more affected than sandy soils. |
• Blend or change to an alternative water source. • Apply a leaching fraction with every irrigation. • Inject S or Ca2+ into the water. • Reverse osmosis. • Disrupt soil surface to break any crusts and for aeration. • Incorporate deep drainage. |
|
Residual sodium carbonate (RSC) meq/L |
Residual sodium carbonate: another method used to assess Na+ hazard of irrigation water sources. | < 1.25 | 1.25–2.50 | > 2.50 |
Bicarbonates and carbonates: high affinity to form insoluble precipitates with Mg2+ & Ca2+. When precipitates form, need excess divalent (2+) cations available to bind with all CO32-and HCO3- with enough remaining to aggregate soil particles. If inadequate divalent cations are available and irrigation water contains Na, the pool of Mg and Ca is used to satisfy the CO32- and HCO3- leaving no extra divalent cations to aggregate soil particles. The Na is left to bind with soil particles, leading to soil dispersion, less aggregation, fewer soil pores and decreased water infiltration. |
• Blend or change to an alternative water source. • Apply a leaching fraction with every irrigation. • Inject S or Ca2+ into the water. • Reverse osmosis. • Disrupt soil surface to break any crusts and for aeration. • Improve deep drainage. |
Credit: Sarah White, Clemson University
† For turfgrass
‡ For sensitive ornamental plants
* Not for clay soils
∫ Ornamental plants exhibit a wide range of tolerance
Understanding units in this table: Parts per million (ppm) express concentration by weight and are commonly used for nutrients and salts. Milliequivalents per liter (meq/L) account for the chemical charge of ions and are used to evaluate sodium hazards (such as SAR and RSC) that affect soil structure and water infiltration.
Key irrigation water quality indicators to evaluate first
-
Electrical Conductivity (EC) – overall salinity risk
-
Sodium Adsorption Ratio (SAR) – soil structure and infiltration risk
-
Nitrate-N – nutrient contribution and groundwater concern
-
Boron – toxicity risk to sensitive crops
Water quality laws and regulations
The federal Clean Water Act regulates the discharge of pollutants into surface waters of the United States. Under this framework, states adopt Water Quality Standards (40 CFR 131) to protect beneficial uses such as aquatic habitat, recreation, and drinking water supply.
In Oregon, the Oregon Department of Agriculture is responsible for preventing and controlling water pollution from agricultural activities. The department is also responsible for ensuring that farmers and ranchers help achieve water quality standards and help meet the agricultural pollutant load allocations assigned by the Oregon Department of Environmental Quality.
The Oregon Department of Agriculture works with local agricultural groups to update and implement agricultural water quality management plans and rules that address water quality issues and management actions throughout the state. To find out more about your agricultural water quality management plan and administrative rules in your area, see the Oregon Department of Agriculture website.
Avoiding water quality problems through irrigation water management
- Operate your irrigation system so that the timing and amount of irrigation water applied matches your crop water needs.
- Know your soil’s water-holding capacity and use soil moisture monitoring techniques to know when to irrigate.
- Use irrigation water scheduling methods (checkbook or scheduling applications) to ensure proper timing of irrigations.
- Invest in irrigation equipment upgrades.
- Annually inspect and maintain irrigation equipment.
- Periodically test your irrigation water to determine if contaminants are present and if changes in management are needed.
- Periodically soil test to determine if contaminants are present and if changes in management are needed.
Implementing good irrigation water management practices will ensure the viability of your operation and reduce the risk of water quality issues in your watershed.
References and resources
Hopkins, Bryan G., Donald A. Horneck, Robert G. Stevens, Jason W. Ellsworth, Dan M. Sullivan. Managing irrigation water quality for crop production in the Pacific Northwest. 2007, OSU Extension.
Natural Resource Conservation Service, National Water Quality Handbook, 2003.
Oregon Department of Agriculture, Agricultural Water Quality Plans.
Oregon Department of Environmental Quality, Groundwater Management Areas.
Park, Dara M., Sarah A. White, L.B. McCarty and Nick Menchyk, Interpreting Irrigation Water Quality Reports, CU-14-700, 2014, Clemson University, Clemson Cooperative Extension Service,
Swistock, Bryan. Interpreting Irrigation Water Tests, Basic interpretation of how various water quality parameters can influence plant growth during irrigation, 2022, Penn State Extension.
United States Environmental Protection Agency, Clean Water Laws, Regulations, and Executive Orders related to Section 404 | US EPA.
United States Environmental Protection Agency, National Management Measures to Control Nonpoint Pollution from Agriculture, Chapter 4.
United States Geological Survey, Agricultural Contaminants, 2019.
Zamora Re, María I., Abigail Tomasek, Bryan G. Hopkins, Dan M. Sullivan and Linda Brewer. Managing salt-affected soils for crop production. 2022, OSU Extension.
Zhang, Hailin, Understanding Your Irrigation Water Test Report, L-323, 2017, Oklahoma State University Extension.
Acknowledgments
This material is based upon work supported by the National Institute of Food and Agriculture, U.S. Department of Agriculture, under award number 2021-38640-34695 through the Western Sustainable Agriculture Research and Education program under project number WPDP22-020. USDA is an equal opportunity employer and service provider. Any opinions, findings, conclusions, or recommendations expressed in this publication are those of the authors and do not necessarily reflect the view of the U.S. Department of Agriculture.
Reviewers included Matthew Alongi, Natural Resources Conservation Service State Irrigation Engineer; Mylen Bohle, Associate Professor, Emeritus, Oregon State University; Leslie Clark, Central Oregon Irrigation District; Jeremy Giffin, Carolyn Sufit and Rachel Lovellford, Oregon Water Resources Department; Gen Hubert, Deschutes River Conservancy; Troy Peters, Professor and Extension Irrigation Engineer, Irrigated Agriculture Research and Extension Center, Washington State University; Rex Barber of BigFalls Ranch, Terrebonne, Oregon; Mike Macy of Macy Farms, Culver, Oregon; and Patrice Spyrka of Tumalo Alpine Ranch, Tumalo, Oregon.
Nina Caldwell and Olivia Jasper of the Oregon Department of Agriculture and Ellen Hammond of Jackson Soil and Water Conservation District contributed to this report.
About the authors


Related publications