Grazing management in sagebrush country is akin to walking a tightrope. It requires constant input and adjustment to maintain equilibrium. Grazing managers must continually assess conditions and adjust to balance forage needs with an ever-changing supply. The sagebrush ecosystem faces landscape-scale dangers that threaten to hurt productivity on hundreds of thousands of acres annually.
Settlers in the late 1800s and early 1900s mismanaged livestock grazing, introduced invasive annual grasses and suppressed upland fire, allowing highly competitive conifer species to expand into productive rangelands. Today, grazing managers must balance forage intake with maintaining rangeland health. They must innovatively utilize grazing to improve ecological conditions and mitigate the damage and expansion of large-scale threats. Creative grazing and following the principles of threat-based land management can help managers and producers achieve rangeland management goals.
Threats to the sagebrush ecosystem
The sagebrush ecosystem is an imperiled North American ecosystem. It is shrinking at an alarming rate. In the northern Great Basin, expanding native conifers, such as western juniper, invasion by annual grasses and related alterations in fire regimes pose serious risks. These threats vary by elevation; too much fire plagues lower, warmer areas of Wyoming big sagebrush, and not enough fire occurs at higher, more mesic sites associated with mountain big sagebrush.
At lower elevations, invasive annual grasses such as cheatgrass (Bromus tectorum), medusahead wildrye (Taeniatherum caput-medusae) and ventenata (Ventenata dubia), thrive in disturbed areas, outcompeting native perennial bunchgrasses. These invasive annual grasses grow quickly and densely, invest heavily in reproduction and dry out and die early in the season. The resulting continuous fuel beds precipitate larger and more frequent fires that eliminate desired perennial grasses.
At higher elevations, reduced wildfire has allowed native conifer populations to expand into historic shrublands. Unchecked conifer expansion can reduce the abundance of desirable perennial plants and hurt forage production and wildlife. At midelevation sites, invasive annual grasses and conifer expansion have increased fragmentation and reduced rangeland productivity. Large perennial bunchgrasses are key to maintaining ecosystem productivity, resiliency and resistance to threats like invasive annual grasses. For more information on sagebrush rangeland ecology and the important role large perennial bunchgrasses play, see Western Roots: Diving into a sagebrush sea of diversity (PNW 714) in the Oregon State University Extension catalog.
Threat-based land management
To effectively manage grazing in sagebrush country, first assess and prioritize the primary threats. The threat-based land management framework allows managers to efficiently assess ecological conditions and threats, prioritize areas and resources and implement management plans at scales relevant to the ranching operation. Threat-based land management allows managers to map a property into simplified categories (A–D) based on the associated threats. Areas in good condition are denoted with an A, while areas converted to invasive annual grasslands or closed conifer woodlands are graded a D. Threatened sites that are improving or declining fall in the middle. Threat-based land management also offers tools for estimating likely change (rangeland trends), defining management objectives and prioritizing management actions. For comprehensive background on this approach, see Threat-Based Land Management in the Northern Great Basin: A Manager’s Guide (PNW 722) and Threat-Based Land Management in the Northern Great Basin: Field Guide (PNW 723).
In this publication, we will build on the threat-based land management framework and, using a hypothetical 10,000-acre ranch as an example, demonstrate how grazing can help achieve desired ecological conditions. To do this, we will work through the following questions:
- Where are we? (What threats and ecological conditions exist?)
- Where do we want to be? (What rangeland conditions do we want to promote, and are our management expectations realistic?)
- How do we get and stay there? (What type of grazing or management will help us succeed?)
- Are we improving conditions? (How should we monitor the change we create?)
- What should we change? (How can we identify when and how to adjust our approach?)
1. Where are we?
First, we must assess our current conditions. We can do this using the threat-based land management approach to map the three pastures comprising our 10,000-acre ranch. The primary threat to the function and productivity of healthy State A rangeland is wildfire and the associated risk of invasive annual grasses. Generally warmer, drier areas of the ecosystem are at the greatest risk for conversion. Our pastures, dominated by Wyoming big and low sagebrush, fall into this category. With the threats of wildfire and invasive grasses in mind, we will map our pastures based on the current and potential expression of these threats.
Figure 1 shows our three pastures mapped in Google Earth Pro, a free Global Information System tool that allows for the creation, storage, analysis and communication of geographic or spatial information. Here, we have categorized each pasture into different states using the threat-based land management process.
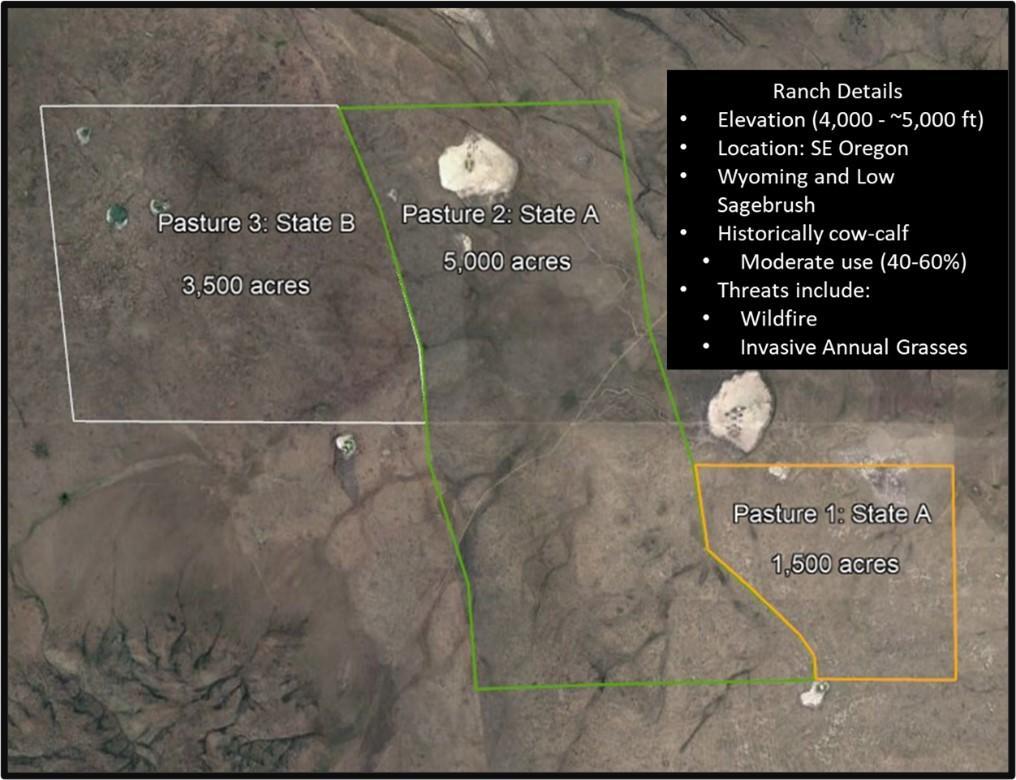
We used Google Earth as a first assessment to categorize the pastures, noting any potential problem areas within each pasture based on our knowledge of conditions in the pasture and on what we can see from the Google Earth imagery. For example, weed and conifer patches may often be identified in the imagery available on Google Earth. Our two easternmost pastures appear to have plenty of sagebrush cover, while the westernmost pasture is predominately grass (Figure 1). We do not see any obvious weed patches using Google Earth, so we map the two eastern pastures as State A (sagebrush rangeland with a perennial understory) and the western pasture as State B (perennial grassland without shrubs). Next, we assess the condition on the ground to verify and refine our initial mapping assessment. (See Threat-Based Land Management in the Northern Great Basin: A Field Guide, (PNW 723) for more details). During this evaluation, the manager looks for indicators of trends. While a useful tool, these indicators are not a substitute for actual trend information. Instead, apparent trends help identify where additional monitoring might be needed and provide useful information without actual trend information.
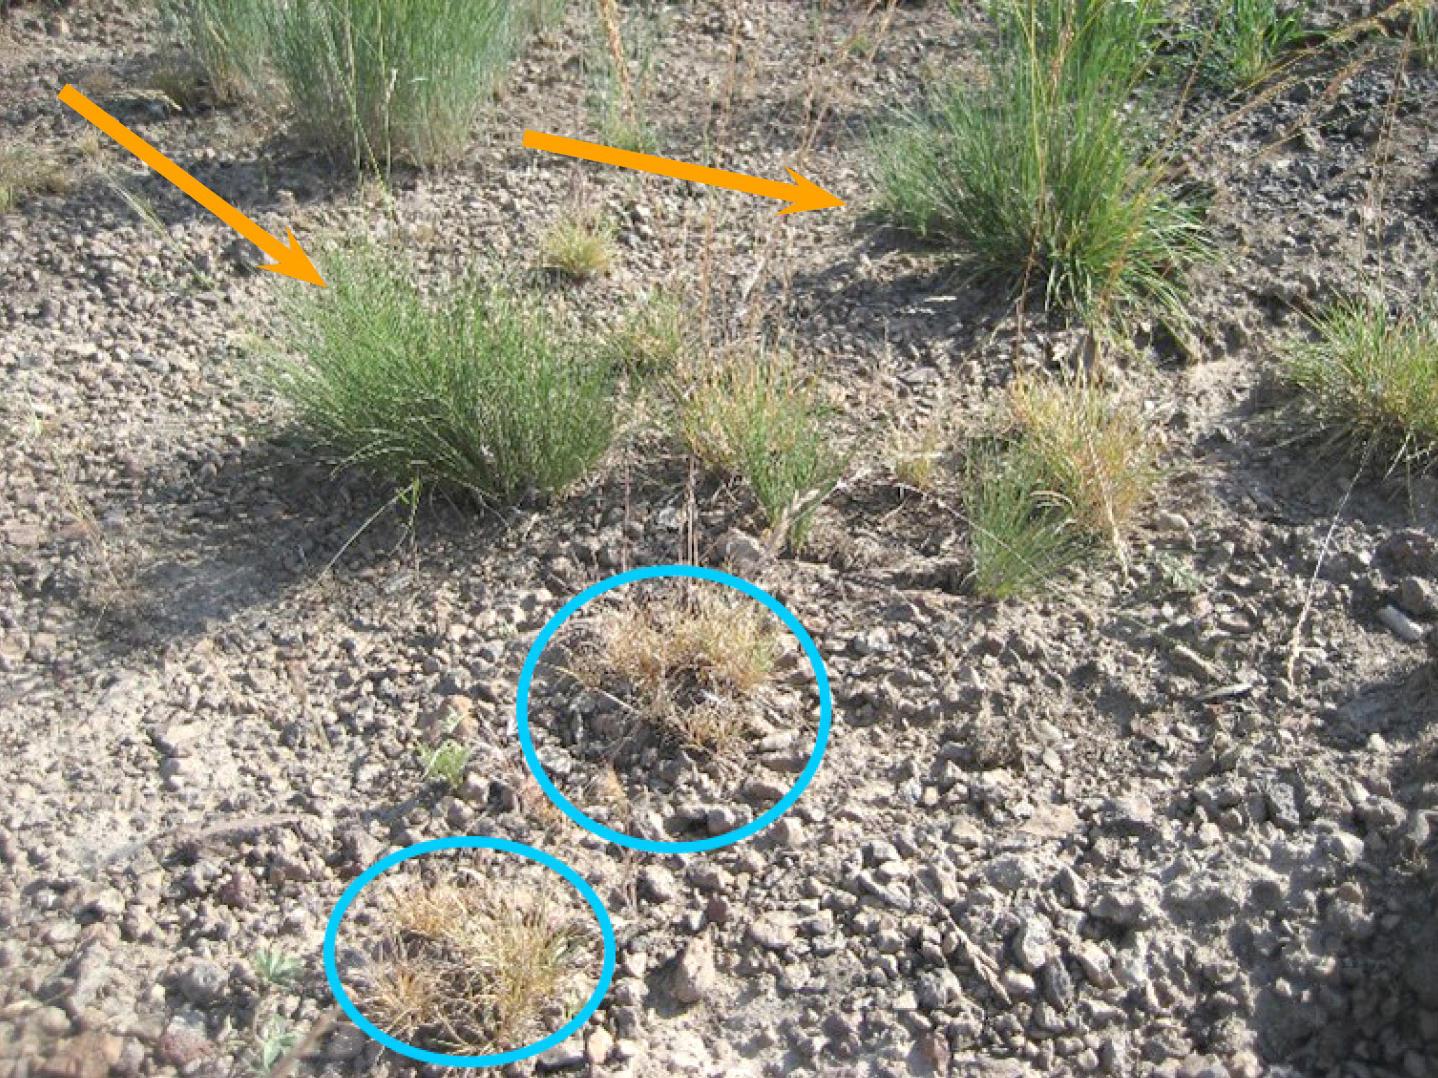
As we walk around Pasture 1 (click to view a 360-degree photo of the pasture), we see a healthy overstory of low sagebrush with an understory of perennial bunchgrasses. However, we do not observe many deep-rooted perennial bunchgrasses. The site’s understory is dominated by Sandberg’s bluegrass (circled in blue in Figure 2), a native, shallow-rooted bunchgrass that dries out earlier in the season than deeper-rooted bunchgrasses (orange arrows). Consequently, the forage production here seems to be low. Fortunately, we do not observe any invasive weeds at this site.
What is this site’s potential for forage production and rangeland health? Are the deep-rooted bunchgrasses gone because of past management (such as overgrazing), or will this site only support shallow-rooted grasses? We need more information to answer these questions. The USDA Natural Resources Conservation Service’s Web Soil Survey is a great resource that provides soil information and links to ecological site descriptions for many areas throughout the U.S. It includes information on soils, the native species we might find at the site and production potential estimates.
| Ecological Site Description (ESD) | Clayey Playette | Loamy 10-12 PZ | Clayey 10-12 PZ |
|---|---|---|---|
| Physiographic features | Site occurs in dry lake basins and valley floors. Slopes range from 0%–3%; elevations from 4,000 feet to 4,600 feet. | Typically occurs on rolling uplands and lake basin terraces. Slopes are 2%–20%, elevations from 4,000 feet to 6,000 feet. | Found on terraces, rolling uplands and foothills. Slopes 0%–30%, but gradients of 2%–20% typical. Elevations from 4,500 feet to 6,000 feet. |
| Plant community | Wyoming big sagebrush dominates. Bottlebrush squirreltail and some Sandberg bluegrass dominate the grass/forb layer. Sandberg bluegrass scattered on the contrasting bare playette. Forbs are a minor component. Potential composition: about 55% grass, 40% shrubs and 5% forbs. Ground cover is 20%–40% (basal and crown). | The potential native plant community is dominated by Thurber needlegrass and Wyoming big sagebrush. Indian ricegrass and Sandberg bluegrass are other important grasses associated with this site. Vegetative composition is about 80% grasses, 5% forbs, and 15% shrubs. Approximate ground cover is 15%–25% (basal and crown). | The potential native plant community is dominated by bluebunch wheatgrass and Wyoming big sagebrush. Thurber needlegrass and Sandberg bluegrass occur commonly on the stand. Vegetative composition is about 75% grass, 10% forbs and 15% shrubs. Approximate ground cover is 15%–25% (basal and crown). |
| Soil features and available water holding capacity (AWC) | Fine-textured, very deep and somewhat poorly drained. AWC is 6–10". | Typically shallow to moderately deep over hard bedrock. AWC is 2–5". | Soils shallow to deep over bedrock. Fine-textured clay below 8–10". Surface loam or clay loam with clay and/or silty clay subsoil. Well-drained with slow permeability. AWC 1–5". |
| Annual grass production | Low: 55 lbs/acre; Representative: 165 lbs/acre; High: 220 lbs/acre | Low: 480 lbs/acre; Representative: 640 lbs/acre; High: 800 lbs/acre | Low: 525 lbs/acre; Representative: 675 lbs/acre; High: 900 lbs/acre |
Follow step-by-step instructions. ESD websites: Clayey Payette, Loamy 10-12 PZ and Clayey 10-12 PZ
Table 1 summarizes some of the information provided by the ecological site description found through the web soil survey for this site. To find this information for your pastures, visit this Extension web article for more detailed instructions. To learn more about ecological site descriptions, visit the conservation service’s website.
We can see that Pasture 1 has shallow, finely textured soils typical of dry lake basins and valley floors. It likely will not support a high density of deep-rooted bunchgrasses. This means the site condition is in line with its potential and was accurately categorized as an A — healthy rangeland (albeit with low productivity). We need to maintain this condition with our grazing regime.
If the understory was dominated by Sandberg’s bluegrass and invasive annual grasses and the WSS indicated it could support deep-rooted perennials such as bluebunch wheatgrass and Idaho fescue, we would have instead mapped this pasture a C. Pasture 2 (click to view a 360-degree photo of the pasture) was also mapped as an A in Google Earth Pro (Figure 1). However, according to the web soil survey (Figure 3), this site has a higher forage production potential (grass production of 640 pounds per acre compared to 165 pounds per acre in Pasture 1) and could be dominated by deep-rooted perennial species, such as Thurber’s needlegrass.
By examining the site, pictured in Figure 3 and the 360-degree photo, we confirm this pasture was correctly categorized in Google Earth as State A and does appear to have higher forage productivity than the neighboring pasture, as the web soil survey indicated. Moving on to Pasture 3 (click to view a 360-degree photo of the pasture), we see that our Google Earth assessment was correct. There is little to no sagebrush on the site (Figure 3). It appears that this site burned recently but is dominated by deep-rooted perennials with minimal presence of invasive weeds. A visit to the web soil survey indicates that this site has similar potential to Pasture 2, as both plant communities are dominated by deep-rooted perennial bunchgrasses and have similar grass production (Figure 3).

Now that we understand our current conditions, we can lay out a plan of where we want to be.
While all these pastures are in good condition as State A sites, we know that ecosystems are never static. Trends tend to move upward towards improvement or downward towards conditions that are more “at risk” from threats. Our on-the-ground observations reveal that the bunchgrass population consists primarily of mature plants and very few seedlings or younger, smaller plants. We also noticed that in some areas, cheatgrass and other annual grasses have begun to invade. Minimal presence of annual grasses typically would not cause great concern in State A sites. But when coupled with an apparent trend of a declining bunchgrass population, it suggests the potential for a downward trend. We want to be proactive and reverse this apparent trend quickly before the plant community degrades into a State C.
Current/historic grazing
Before developing a comprehensive grazing plan (step 3), we must first understand the site’s grazing history. There is no previous monitoring data, so the historical grazing use is the only assessment data available. Past management utilized roughly 50% of the available forage each year, moving from Pasture 1 to 3 in a 7 1/2-month grazing period. We will use the Grazing Response Index, a planning tool that incorporates assessments of past grazing, to evaluate past grazing and help guide future grazing management decisions. This decision support tool reduces pasture grazing management into three categories:
- Frequency of use: How many times an individual plant is defoliated during the grazing period.
- Intensity of use: How much leaf material is removed during the grazing period.
- Opportunity to regrow: Time the pasture has to recover from the grazing event.
Numerical values from -1 to 1 are assigned for frequency and intensity of use categories, and a value from -2 to 2 is assigned for the opportunity for regrowth category. Values for all categories are then summed for the total Grazing Response Index score (Table 2).
| Frequency of use | Intensity of use | Opportunity for rest |
|---|---|---|
| +1: Less than 2 uses | +1: Light use | -2: No chance |
| -1: Little chance | ||
| 0: 2 uses | 0: Moderate use | 0: Some chance |
| -1: 3 or more uses | -1: Heavy use | +1: Most of the season |
| +2: Full season |
The Grazing Resource Index comprises three categories to be evaluated, and their values are combined to give an overall assessment of whether the grazing event is beneficial or harmful in the long term.
A grazing plan where cattle graze a pasture for one week (frequency of fewer than two uses = +1) with high forage use (high intensity = -1) and don't return to that area for a year (long rest opportunity for regrowth = +2) produces a total score of +2. In another scenario, the plan includes summerlong grazing (frequency 3+ uses = -1) with 50% grazing utilization (moderate intensity = 0) and no opportunity for regrowth since grazing continues through the growing season (opportunity to regrow = -2) for a Grazing Response Index score of -3. The Grazing Response Index determines which pastures are working and which should have improved management.
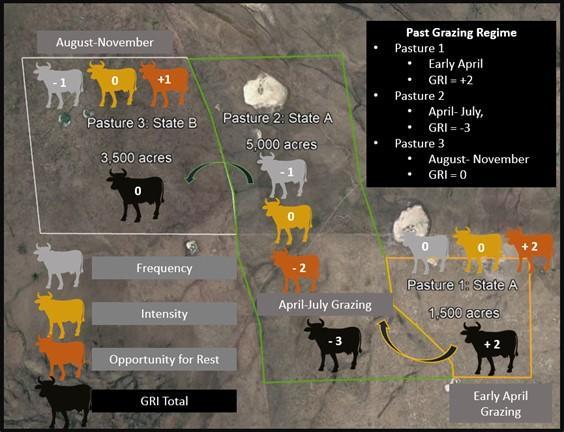
We can utilize the Grazing Response Index to identify if there are any changes needed in our grazing plan (Figure 4). All pastures were managed for a target of 50% utilization, so our intensity for all three pastures will be 0 (moderate use). Pasture 1 is our smallest pasture at 1,500 acres and the lowest in productivity, so our 200 head of cattle historically grazed for approximately 20 days in early April. Due to the short grazing time, the frequency for this pasture is 0 (two uses). The opportunity for regrowth after grazing is close to a year, giving it a +2 score. Therefore, the total score for Pasture 1 is +2 (Frequency = 0, Intensity = 0, Opportunity = +2, Table 2).
Cattle move into Pasture 2 from Pasture 1 and will stay for roughly 3 1/2 months from April to July. With a 3 1/2-month grazing season, frequency is -1 as cattle will most likely graze plants more than three times. Grazing occurs for most of the growing season, resulting in Grazing Response Index scores of -2 for Opportunity to regrow and a total Grazing Response Index score of -3 (Frequency = -1, Intensity = 0, Opportunity = -2, Table 2).
Pasture 3 is also grazed for roughly 3 1/2 months, giving a Grazing Response Index frequency of -1. Unlike Pasture 2, this pasture is grazed at the end of the growing season and into the dormant season, increasing the opportunity for regrowth value to +1 instead of -2. Dormant-season grazing allows the vegetation to complete its growth cycle for the year before grazing occurs, resulting in a higher opportunity score. This gives Pasture 3 an overall Grazing Response Index value of 0 (Frequency = -1, Intensity = 0, Opportunity = +1). Our Grazing Response Index scores from previous years are +2, -3, and 0 for pastures 1, 2, and 3, respectively (Figure 4).
2. Where do we want to go?
Our pasture management goal is for a plant community resilient to wildfire and resistant to invasive annual grasses. The downward trend we observed in the field visit suggests we must change grazing management. Resisting invasive annual grasses and promoting wildfire resilience requires we foster perennial bunchgrasses and their extensive root systems. Deep-rooted perennial bunchgrasses outcompete weedy invasive annuals by occupying all the available space and utilizing all available resources. Based on the Web Soil Survey (Figure 3) and our on-the-ground assessment, our grasses appear to be at, or near, the site’s potential. We must graze to maintain our deep-rooted perennial bunchgrasses and resist invasive weeds. Our pastures are in desirable states, and we need a management plan to keep them there.
3. How do we get there and stay there?
Our assessments place our pastures in state A or B. Will ongoing grazing practices contribute to a downward trend in bunchgrass populations in pastures 2 and 3? Pastures 2 and 3 have neutral or negative Grazing Response Index scores due to their size relative to grazing duration, frequency and timing. (Figure 4). Repeatedly grazing bunchgrasses during the growing season when they are most sensitive can lead to their loss from the ecosystem. Once bunchgrasses are lost, especially in warm, dry sites, it is costly and difficult to restore them. Grazing intensity interacts with the season. Grazing heavily in the spring when grasses allocate resources for seed development will be more detrimental than grazing at the same intensity after seed set. Learn more about how grazing and bunchgrass plant stages in Bunchgrass Phenology: Using Growth Stages of Grasses as Adaptive Grazing Management Tools.
There are many ways to get where we want to be. One potential grazing plan consists of a three-year rotation incorporating deferred-rotational grazing to avoid grazing one pasture during the same season yearly (Table 3). We can improve our Grazing Response Index scores by altering the grazing season and duration. The pasture grazed last the previous year will be grazed first the following year. Last year’s rotation was pasture 1, 2 then 3 (Figure 4). This year, grazing will start in Pasture 3, move to 1 and finish with Pasture 2 (Table 3).
The next year will start in Pasture 2, move to 3 and finish in Pasture 1. The third year starts again in Pasture 1 (Table 3). Unfortunately, differences in pasture sizes require a pasture to be grazed at the same time two years in a row under this grazing regime. However, altering the timing of pasture use each year should allow our desired vegetation more opportunities for regrowth than a grazing plan that utilizes them at the same time every year.
| Month | Previous | Year 1 | Year 2 | Year 3 |
|---|---|---|---|---|
| April | 1&2 | 3 | 2 | 1&2 |
| May | 2 | 3 | 2 | 2 |
| June | 2 | 3 | 2 | 2 |
| July | 2 | 3&1 | 2&3 | 2 |
| August | 3 | 2 | 3 | 3 |
| September | 3 | 2 | 3 | 3 |
| October | 3 | 2 | 3 | 3 |
| November (1st half) | 3 | 2 | 1 | 3 |
Proposed grazing rotation by year for each of the pastures (1, 2 and 3) to help minimize livestock use at the same time and intensity each year.
4. Are we going in the right direction?
No matter how effective a plan appears on paper, variable weather, changing forage availability and animal behavior and preference can result in unexpected outcomes. Thus, managers should incorporate adaptive management into all grazing management plans. Adaptive management consists of implementing a grazing management strategy, monitoring the results and adjusting future grazing based on monitoring outcomes.
As land managers, we must continuously assess conditions to track if we are headed in the right direction. Photo monitoring is a cost-effective tool that allows managers to track and evaluate the apparent trend of a site. See Photo Monitoring for Ranchers Field Guide (PNW 672), Photo Monitoring for Ranchers Technical Guide (PNW 671), and the Oregon Outback video series to learn about rangeland monitoring, where and when to monitor and how to photo monitor. While photo monitoring is a great tool for tracking apparent changes, it cannot fully replace more robust vegetative sampling designed to quantify actual trends.
In addition to adjusting grazing management based on longer-term monitoring of apparent or actual rangeland trends, managers also must prepare to adapt grazing practices in response to changing conditions. For example, having an abnormal rainstorm in August could increase the regrowth of target grasses, potentially justifying heavier use in September. A drought year may reduce plant production and require fewer animals or less time in the pasture. Grazing plans should be continuously reassessed and altered as needed. Document grazing on paper or Google Earth with associated photos from monitoring points. This will aid future planning by allowing managers to compare grazing management changes with plant-community effects to better plan and implement future grazing.
5. What do we need to change moving forward?
After the first three years of our new grazing plan, we notice that pastures 2 and 3 still have insufficient bunchgrasses. Our monitoring ruled out drought as the cause. Our pastures still fall in the state A and B categories, but we see an increasing prevalence of annual grasses. If left unchecked, these annuals could begin to dominate the understory, dropping the pastures to a State C. Our current pasture configuration limits our flexibility for providing adequate rest and rotation. Having only three pastures increases our frequency of use while reducing opportunity in our Grazing Response Index rating. We consider four options to mitigate this concern:
- Cross-fencing: The first option requires cross-fencing these pastures into smaller portions where cattle can be moved more frequently, enabling more rest and recovery time for vegetation. To help reduce cost, members of the Quivira Coalition have successfully used single-strand barbwire fencing for interior cross-fencing. The idea is that livestock should theoretically be moved often enough that challenging the fence is minimal before moving to a new pasture. One-strand temporary fences can more easily be adjusted than permanent fences, allowing managers to fine-tune grazing locations. Once these fences do not move for several years, we will evaluate the potential for a permanent replacement fence.
- Stockmanship: The second consideration utilizes stockmanship to physically move cattle within the larger pasture. Managers can learn from experts how to work livestock in a way that encourages livestock to stay and move together on the landscape, including being “placed” and staying where the handler puts them until they are moved to another location within the pasture. Resources on this type of stockmanship can be found on Cattle Sense, Stockmanship Journal, and Cattle Up Stockmanship websites. Although learning these techniques takes time, these livestock handling methods should be more efficient than prior management.
- Water development: The third consideration involves adding new water developments to pastures to enable managers to manipulate livestock grazing use by turning water on or off as needed.
- Collaboration: The final consideration involves working with a neighbor to combine herds during the grazing season. In our example, one neighbor is facing the same challenge: due to the size and number of pastures, they lack the flexibility to sufficiently reduce the frequency of use on their ranch. In this scenario, we could develop a comprehensive grazing plan that incorporates both ranches and utilizes all 500 head of combined cattle that rotate through pastures on both ranches. This will decrease the frequency while increasing rest (opportunity) to give both ranches more chances to recover from a grazing event before coming back the following year.
Summary of recommendations
Managing grazing to maintain or improve rangeland health is challenging in an environment that experiences variable forage production and ecosystem threats. To be successful, we must understand current conditions, identify realistic desired conditions and plan how to get there. Threat-based land management provides a simplified framework for efficient identification, evaluation and communication of current and desired conditions, and management actions needed to achieve rangeland goals. A well-thought-out plan, however, is only the starting point. Success also requires a commitment to ongoing evaluation of the effects of grazing and a willingness to adapt the plan when circumstances change or conditions are trending in the wrong direction. Rangeland monitoring and the Grazing Response Index are valuable tools for understanding when adjustments in grazing management are needed to make sure we’re headed toward where we want to be. Lastly, and perhaps most importantly, success requires broadening our view of grazing management beyond simply converting forage into pounds of beef to one that considers grazing an adaptively applied resource management tool.
Glossary
Deferred-rotational grazing – The management practice of resting a pasture during the growing season by moving livestock between pastures to utilize areas after the grasses have gone dormant for the year to avoid repeatedly grazing during the growing season. The time between deferred grazing and the number of pastures in the rotation might change but includes deferring grazing until after the seed-set of grasses in at least some years. This generally is applied in late summer, fall or early winter.
Frequency score – A GRI value between -1 and 1 to evaluate how often livestock can graze a single plant before they are removed from the pasture. -1 indicates a single plant is grazed 3+ times while +1 equals a single plant is grazed less than twice. This is a measure of Grazing Frequency (see below).
Google Earth Pro (GEP) – Satellite imagery software that enables the collection, storage and assessment of geospatial information.
Grazing duration – Length of time livestock graze in a pasture.
Grazing frequency – The number of times livestock have an opportunity to regraze plants in a pasture. Frequency increases with the amount of time livestock spend in a pasture. Also note that the longer animals are in one location, there can be great disparities in frequency of use among different plant species where preferred plants are utilized multiple times while undesired plants can be avoided.
Grazing intensity – How much grazing pressure is applied to a pasture. This is typically a factor of grazing duration and stocking density. Intensity is the cumulative effects of grazing on the plant and is often defined as light, moderate, heavy or severe.
Grazing Response Index (GRI) is a tool to evaluate the potential risk of a grazing plan to a pasture. The GRI evaluates a grazing scenario in three categories:
- Frequency: How many times livestock can graze an individual plant during the growing season.
- Intensity: How much plant material is removed during the growing season.
- Opportunity for regrowth: How much time is a plant given to recover from each grazing event?
All three of the categories are scored to give a total GRI score. Total scores of less than 0 are at risk of increased threats, while values above 0 suggest an expected positive trend with fewer threat risks.
Grazing utilization – Percent estimation of available forage used by livestock. This value can be challenging to ascertain as there are many methods. Here are more details on the various methods, the challenges and how to implement each.
Intensity score – A GRI value between -1 and 1 to evaluate how much of a plant is consumed at each grazing event. +1 for light use to -1 for heavy use. This is a measure of Grazing Intensity (see below).
Opportunity for regrowth score – A GRI value between -2 and 2 to evaluate how much time a plant has to recover from a grazing event, with -2 equaling no rest and 2 a full growing season.
Season of grazing – Timeframe (the specific time of year) that grazing is applied to a landscape. Generally, this includes the spring through fall seasons.
Stocking density – The concentration (number or pounds of animals per unit area) of livestock in a pasture at a point in time. Higher densities would equate to higher animal volume or smaller pasture sizes. Typically, it can be measured in head per acre or pounds of livestock per acre.
References and resources
Arispe, S. 2017. Oregon’s Outback. YouTube.
Davies, K. W., C. S. Boyd, J. L. Beck, J. D. Bates, T. J. Svejcar, and M. A. Gregg. 2011. Saving the sagebrush sea: An ecosystem conservation plan for big sagebrush plant communities. Biol. Conserv. 144:2573–2584.
Gearhart, A. 2015. Photo Monitoring for Ranchers Field Guide. PNW 672
Gearhart, A. Launchbaugh, K. 2015. Photo Monitoring for Ranchers Technical Guide. PNW 671
Johnson, D. 2019. Grazing Management Options for Riparian Areas.
Johnson, D. Cahill, M. Boyd, C. Schroeder, V. Foster, L. Sitz, A. Kerby, J. Svejcar, T.J. Cupples, J. 2019. Threat-Based Land Management in the Northern Great Basin: A Field Guide. PNW 723
Johnson, D. Cahill, M. Boyd, C. Schroeder, V. Foster, L. Sitz, A. Kerby, J. Svejcar, T.J. Cupples, J. 2019. Threat-Based Land Management in the Northern Great Basin: A Manager’s Guide. PNW 722
Schroeder, V., Johnson, D. 2018. Western Roots: Diving into a sagebrush sea of diversity. PNW 714
Schroeder, V., Johnson, D. 2019. Bunchgrass Phenology: Using Growth Stages of Grasses as Adaptive Grazing Management Tools. EM 9276
Reed, F., R. Roath, and D. Bradford. 1999. The Grazing Response Index: Rangel. Arch. 21:3–6.