Introduction
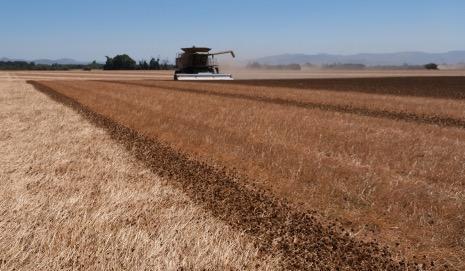
Farmers often try new management practices, technologies or crops in small areas before making changes on a larger scale. On-farm trials help growers test if promising experiment station research results can be replicated on their farms. However, these on-farm trials must be carefully planned to ensure the results are valid.
This publication will describe how to design an on-farm experiment. You will learn about experimental design, including treatments, check plots and replication. Each of these aspects affects the quality of your experiment and determines the time and effort required. In the end, you will know how to design experiments that maximize your time and resources so you can make informed management decisions.
Choosing a research question
The goal of an experiment is to answer a question. On the farm, research questions are often generalized as, “Which management practice is best?” It is easier to plan your experiment if you state your question in a clear, detailed way. As you formulate your question, ensure you can answer the following:
- What management practice do I want to test?
- What effects do I expect that management practice to have?
- What metrics will I use to decide which management practice is best for my situation?
Your research question and available time and resources will dictate the measurements you take to answer your question. Yield is one of the most commonly measured results in on-farm research. However, the goal of many on-farm experiments is to increase profitability, which means you should keep track of any differences in costs related to inputs or management. A small decrease in yield might be acceptable if it comes with reduced input costs, environmental benefits, increased crop quality or other valuable outcomes. If you are testing an additional input product, consider what yield increase you need to justify the additional input cost. Other measurements can include crop quality, disease or pest pressure, soil quality or other results depending on your research question. Besides profit, consider what else is important to you. Practices that improve sustainability and soil health may not benefit your bottom line in the short term but can ensure your farm is in better shape for future generations.
Selecting treatments
To answer your research question, compare different management practices or treatments applied to adjacent plots. One treatment should be a control that is your standard management, while the other treatment is an alternative management practice that you want to test. Carefully plan how you will manage each treatment. Any difference between the treatments could affect yield or other outcomes.
Many management practices work well in some conditions but not in others. For example, adding fertilizer increases yield, but only if that nutrient is deficient and limiting yield. Researchers call this an interaction. When designing an experiment to test a management practice, do it under conditions where the difference will be most obvious. This is especially true for practices that make crops more stress-tolerant. Practices that are expected to increase soil water-holding capacity should be tested under conditions where crop growth is limited by water availability. You should test stress-tolerant crop varieties in situations where that stress is present. Products that claim to increase nutrient uptake should be tested on crops grown in nutrient-limited conditions. You can do this by applying less fertilizer or choosing a field with lower soil fertility.
Case study: a new soil amendment
Jane is just back from a growers’ meeting, where she learned about a new soil amendment. According to the marketing material, Mineral BOO$TER 10000 increased yields for farmers in other states. The dealer showed impressive photographs of healthy, dark green, vigorous crops and provided testimonials about the benefits in several different cropping systems. Feeling lucky, Jane entered the door prize raffle and won a bag of MB 10000 to use on her farm.
Back home, Jane was excited to try the amendment but could not decide how much to apply. The bag said to apply MB 10000 “as needed” with a suggested rate of 5–10 pounds per acre. But the label noted that higher rates could produce additional benefits. Jane is skeptical about silver bullets in farming, so she decided to test MB 10000 herself. She called the local Extension office for MB 10000 information and application recommendations.
The importance of a control
Imagine a farmer growing wheat using the same management for many years. He switches to a new practice and notices a yield increase. Without a control, or check plot, where wheat was grown using prior practices, he can’t be certain the new practice caused the yield increase. The weather or some other factor may have been responsible.
A control allows you to make a direct comparison between the old practice and the new one. Treat your control exactly like the other treatment plots, except for the difference or differences you are testing. This means the weather, soil, planting date, fertilizer, pest pressure, irrigation and application timings are all the same unless they are part of your research question.
Sometimes you may want to compare a set of management practices or systems with another. For example, transitioning from conventional tillage to strip tillage could affect planting time. In this case, compare your control (conventional tillage at your usual planting date) to a treatment (strip tillage with a different planting date). You wouldn’t be able to tell whether the planting date or tillage caused the difference between your treatment and control, but you could see which practices worked better. To know which of these—tillage or planting date—caused the difference between your treatment and control, change only one practice in your treatment relative to your control. If you are more interested in the overall outcome of a set of practices, multiple differences between the control and experimental treatments are OK.
Replication and randomization
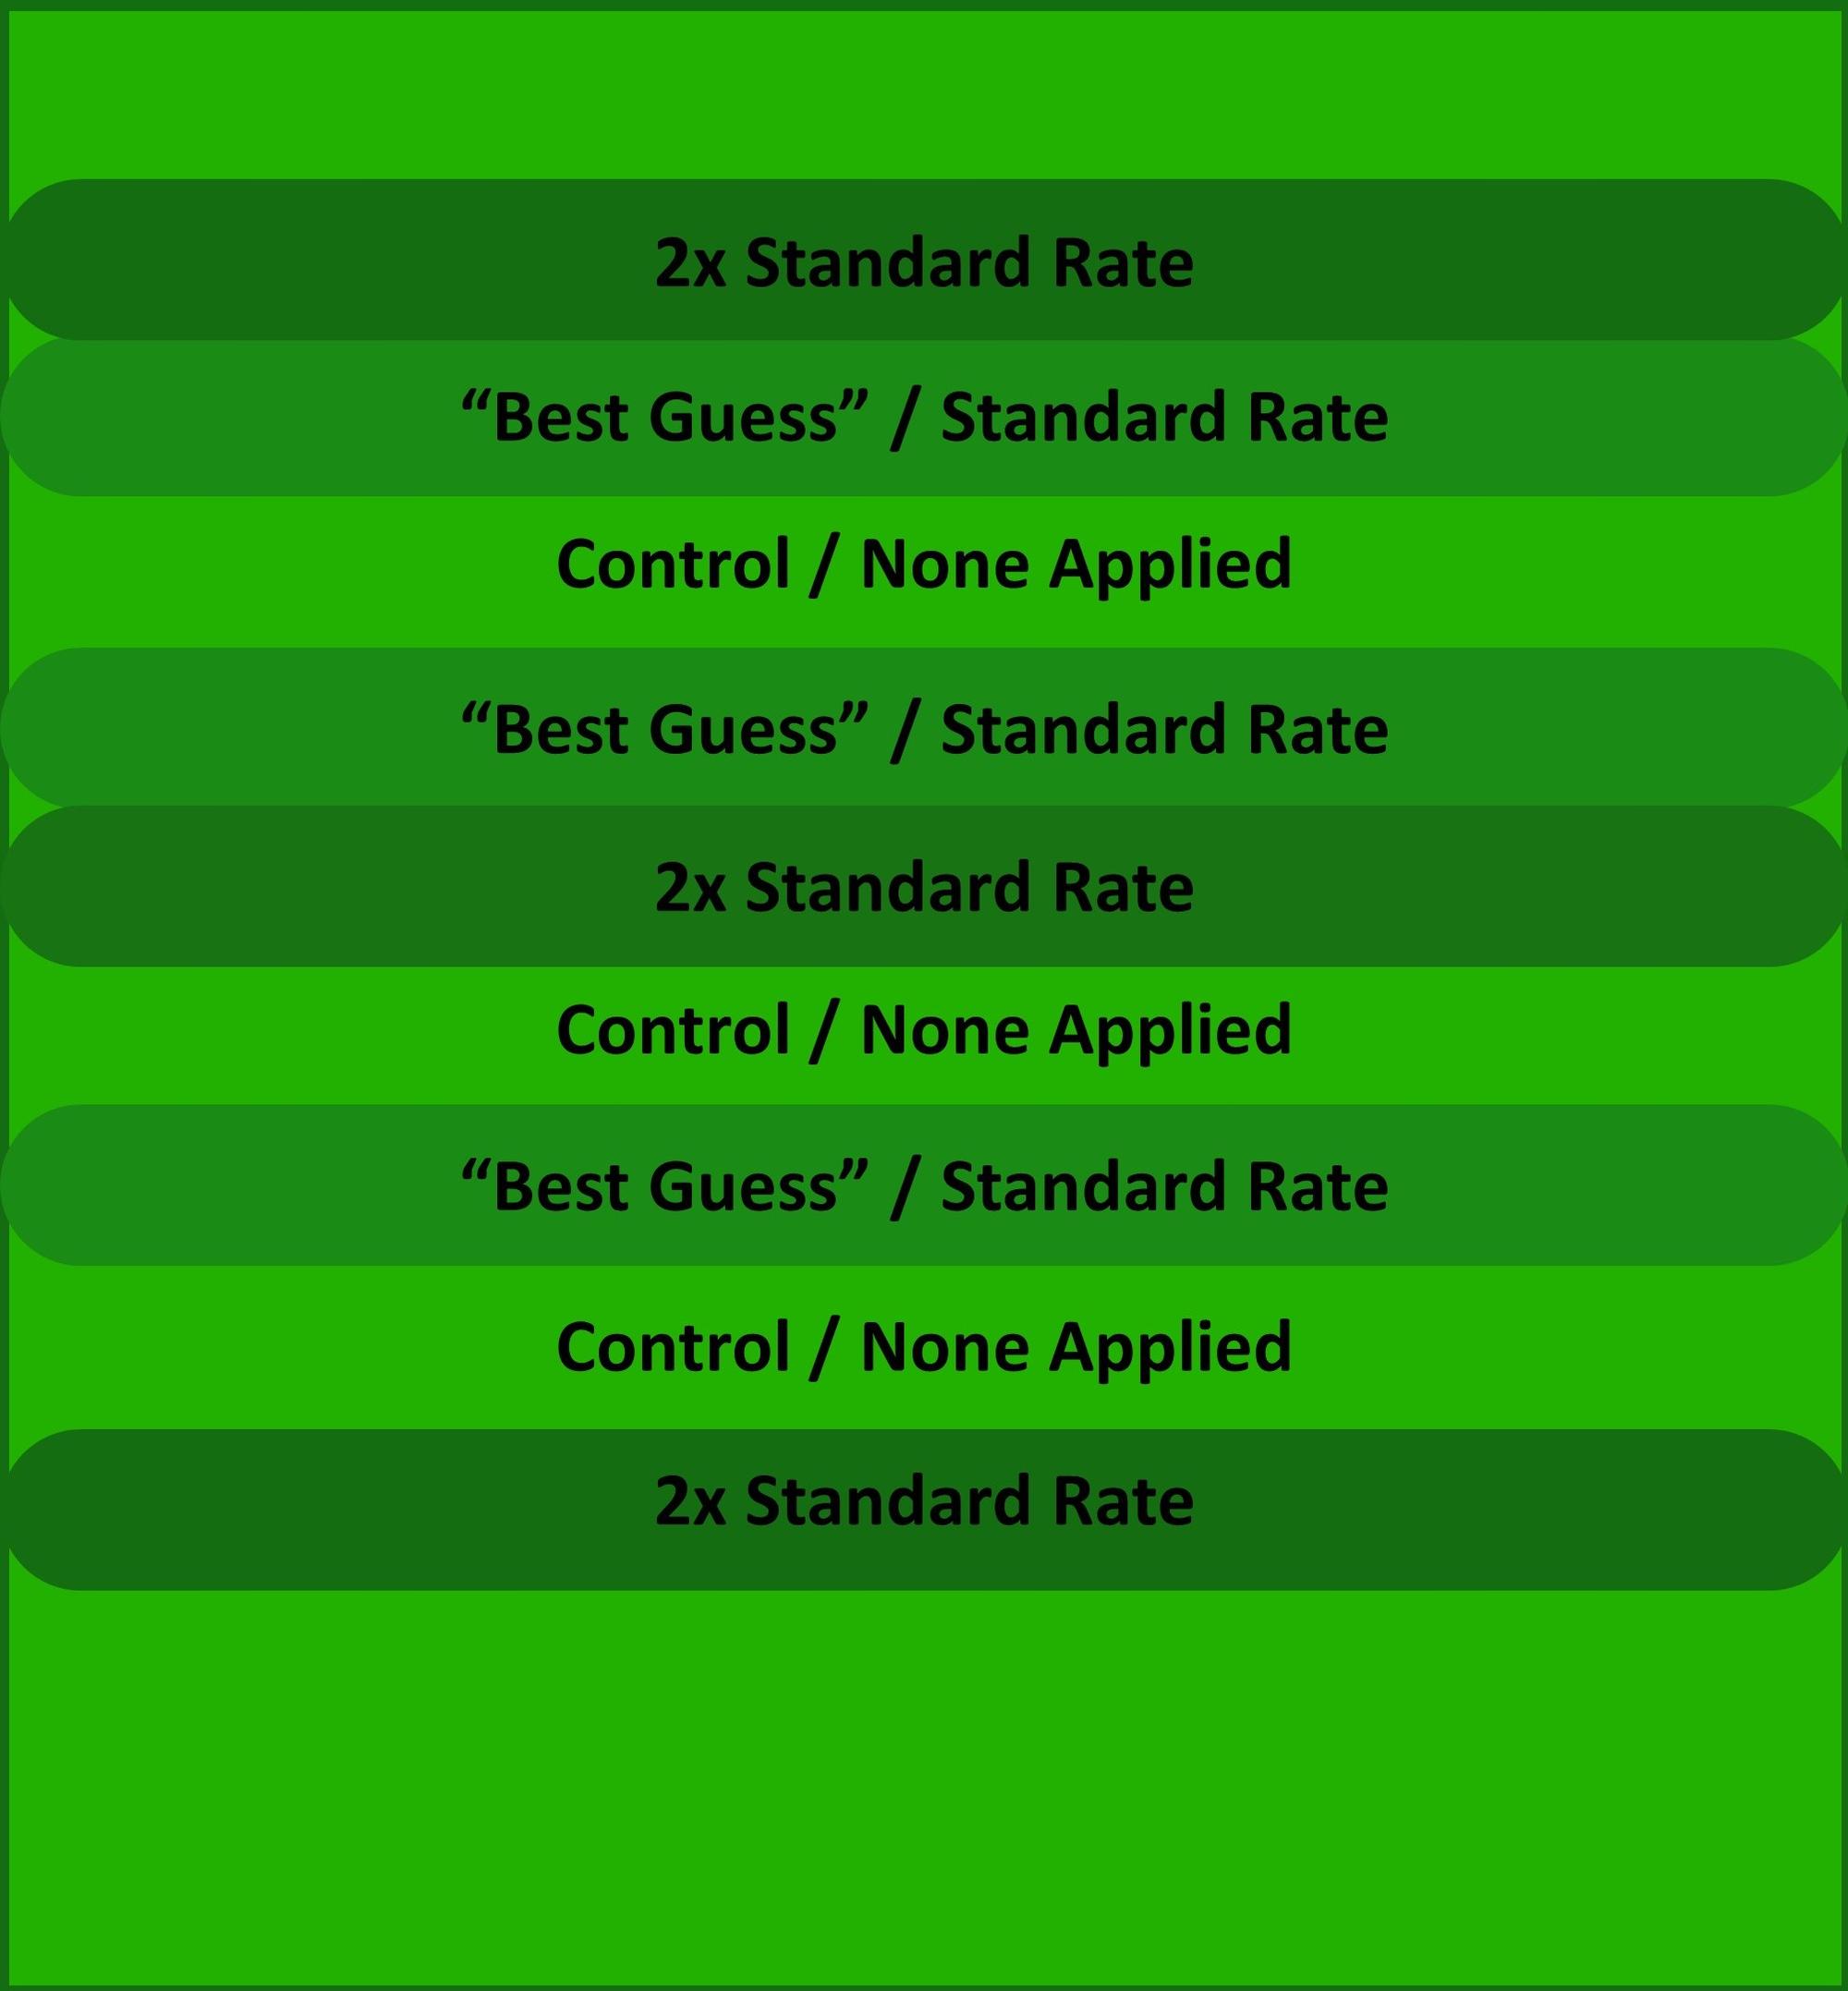
Including replication in your experiment means that the experiment is repeated multiple times, with multiple plots for each treatment. Replication should be combined with randomization, meaning that you flip a coin or use some other random method to decide what treatment is applied to each plot. Replication and randomization increase your chances of detecting a difference between treatments if one exists.
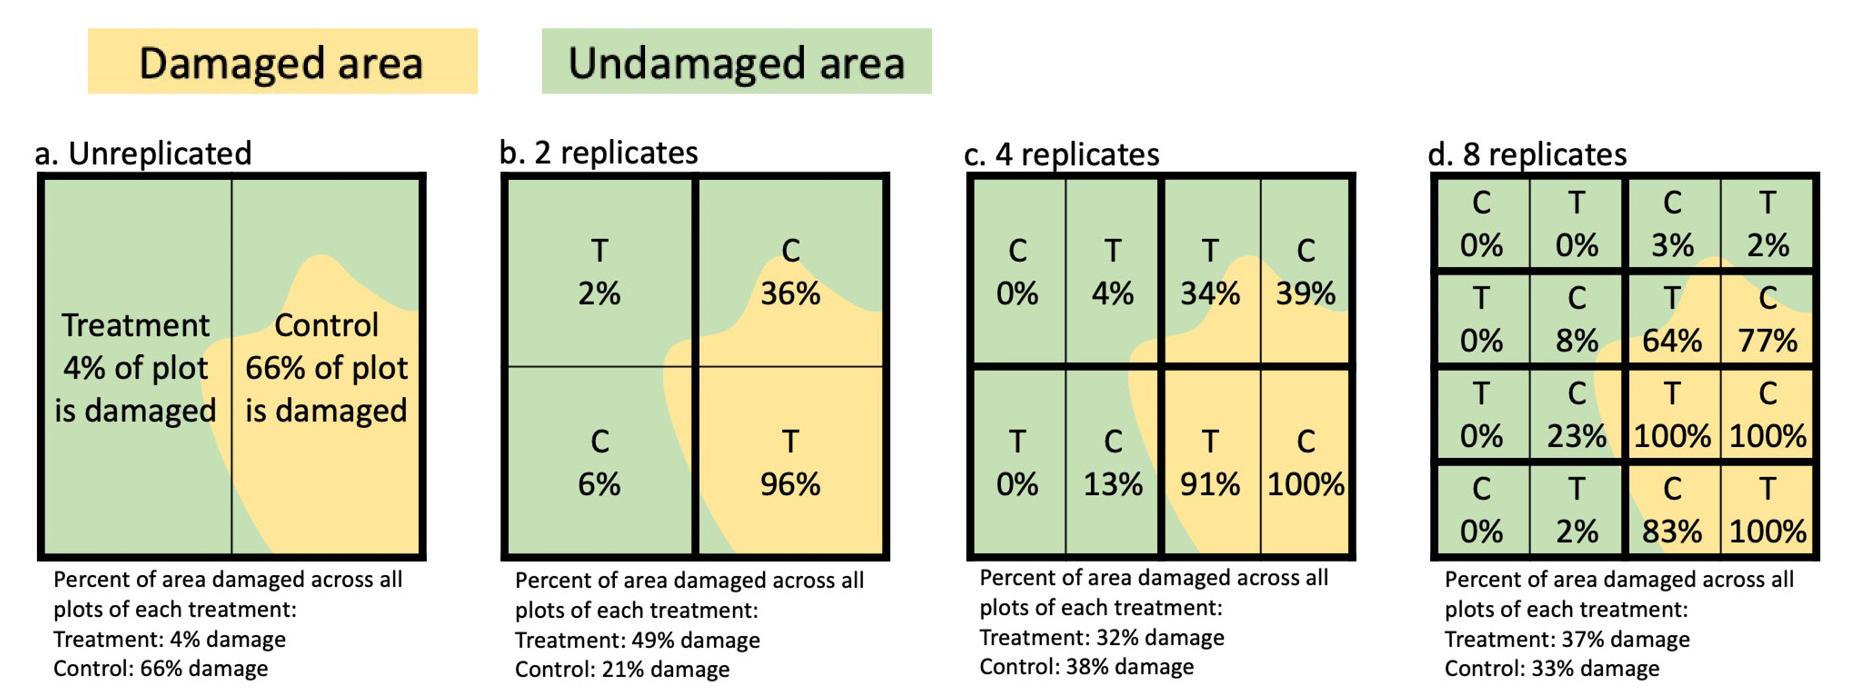
Figure 2 shows how a hypothetical experiment with different numbers of randomly arranged replicates would be affected by a pest outbreak in part of the field. If the experiment is not replicated, the pest damage is likely to affect one treatment more than the other, leaving you wondering if any difference in yield was caused by the treatments or by the pest damage. As the number of replicates increases, the damage is more evenly distributed across the treatments, so it is less likely to be causing a difference between the treatments.
Field trials are typically replicated across a field at multiple locations or over multiple years. Replication in at least one of these forms is usually necessary to build confidence in the results. The number of replicates determines how large of a difference between treatments you will be able to detect. If the treatment you are testing might cause a crop failure or a very large yield reduction, two replicates, or even an unreplicated study, provide the information you need to decide not to use that practice. If a treatment increases yield by 5%, you need many more replicates to show that difference conclusively.
The ideal number of replicates depends on how much variability there is in your field and how much difference there is between the new management practice and your control, These are not easy to know in advance. You can add replications by repeating the experiment over multiple years.
Things to consider:
- If you are testing a major change to your management system, start with a small pilot study. If the practice shows promise, test it again the following year with more replicates and larger plots.
- If you are testing a minor change to your management and you want to gain more information in a shorter time, start with at least four replications. Repeat the following year if you want more data.
Plot layouts
In field trials, divide plots into groups or “blocks” of adjacent plots with similar characteristics. You should end up with one block per replication of your experiment, and each block should have one plot for each treatment. Within each block, randomly choose what treatment goes in which plot. This helps evenly distribute the plots of each treatment across the field. If you have two treatments, you can flip a coin to choose which treatment goes in the first plot in the block and assign the other treatment to the second plot. For more treatments, you can draw treatments from a hat or use a random number generator.
A plot layout is the arrangement of plots across the field. When planning a plot layout, consider the plots' size and shape, the number of treatments and replications, and any variation in the field. If the number of replicates is the same, larger plots will give you a better idea of how the treatment performs at the field scale than smaller plots.
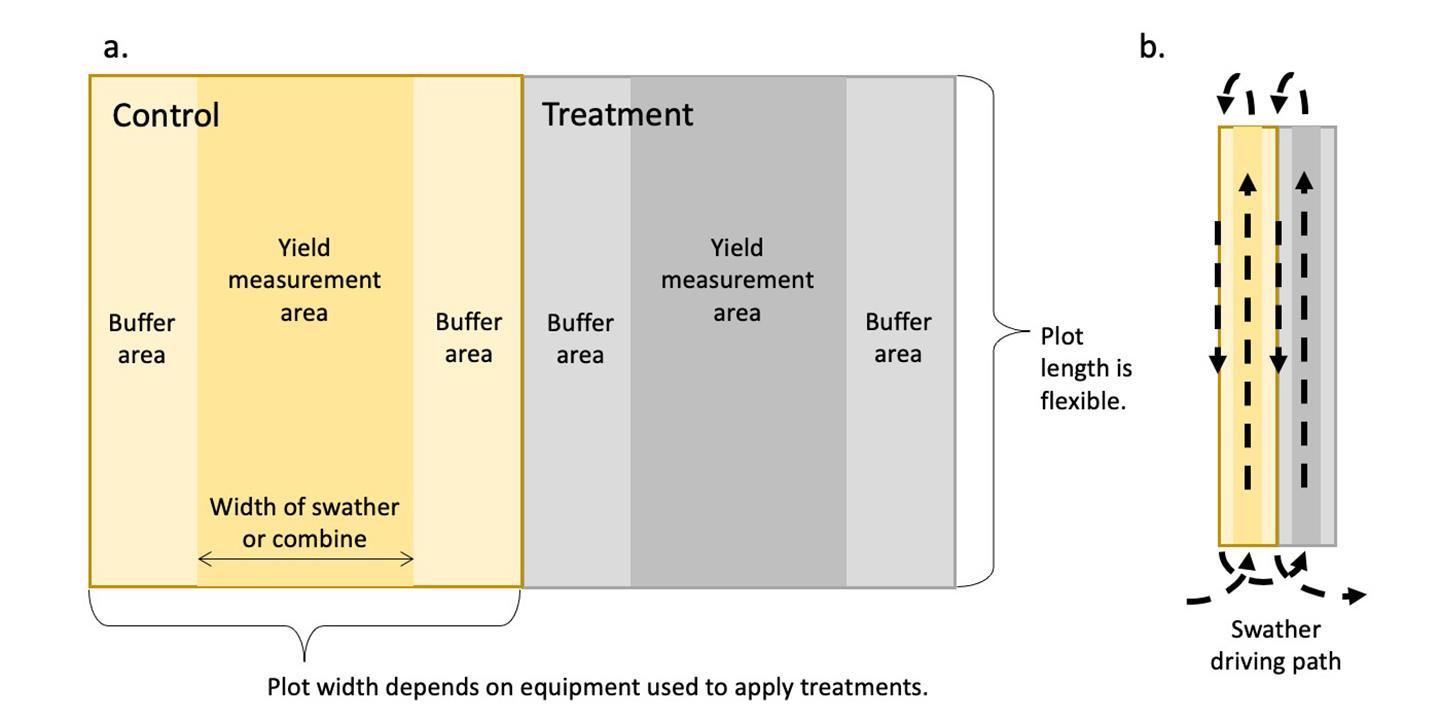
Choose plot dimensions that are easy to manage and harvest with your equipment. Long, narrow plots often work well. The plot width is determined by equipment widths. The plot can be the full length of the field. Treatments can bleed over into neighboring plots, causing the plot edges to behave differently than the centers. Products with a sprayer or spreader can drift onto neighboring plots, and the plot edges can behave differently than the centers without an obvious cause. Avoid these problems by including buffers on the plot edges where no data is collected. Since harvest equipment headers are often much narrower than spray booms or fertilizer spreaders, make the plot width match the width of your application equipment and the yield measurement area match your harvest equipment. If your application equipment is narrower than your harvest equipment, avoid skips and overlaps in the yield measurement area. Figure 3 shows an example of easy-to-manage plots with buffer areas.
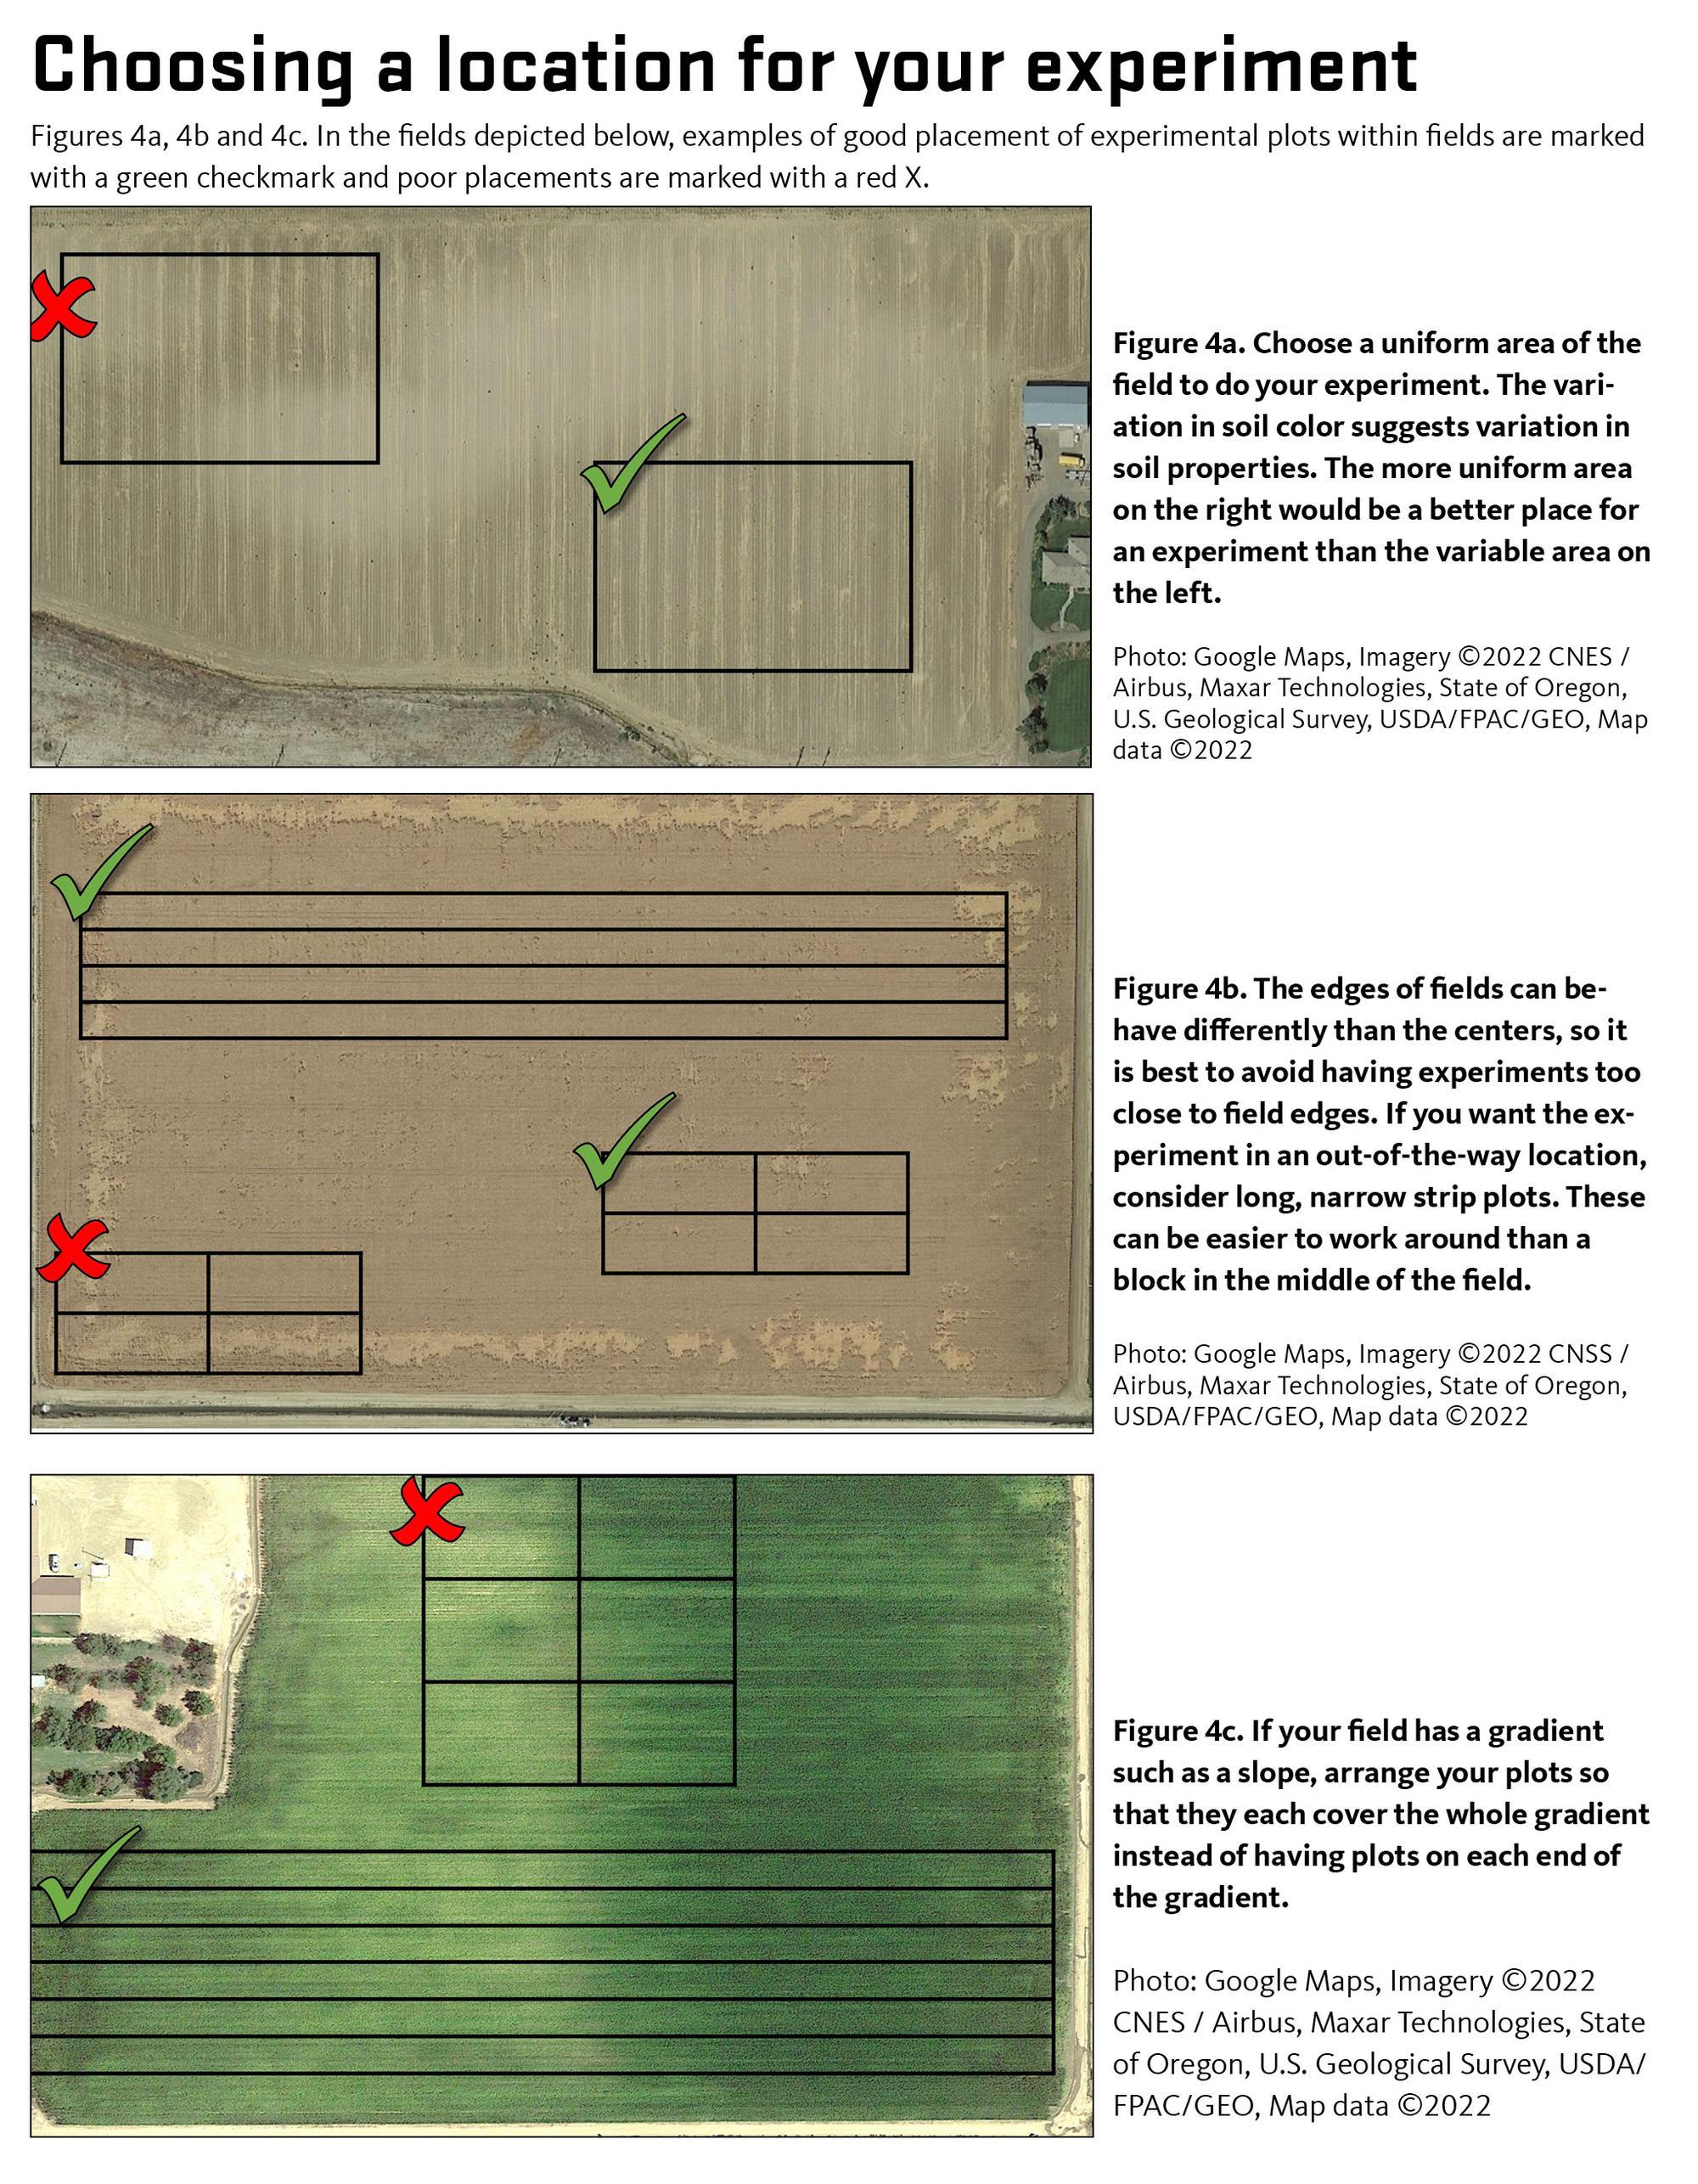
Once you know the number of plots you need (number of treatments times number of replicates) and the dimensions of those plots, look for a field for the experiment. The ideal location has minimal variability and is average compared to the rest of your farm. Evaluate known variations across your farm or field. What parts of your field or farm tend to have higher or lower yields? Soil type, topography or microclimate cause variability that could interfere with your experiment. The tops of hills often differ from the bottoms of slopes. Northern exposures will tend to be cooler than southern exposures. Leveled fields can have variations caused by topsoil being removed from some areas and added to others. Edge effects are also a concern along the borders of fields, especially where it is difficult to broadcast fertilizers uniformly.
Data collection
Take detailed notes of your experiment. Before you start, write down a plan and note changes you make during the experiment. During the growing season, make and record your observations. Some important information to record includes:
- Details of the experimental design
- Plot maps that show which treatment was applied to each plot.
- Descriptions of the management used for each treatment, especially how treatments were managed differently.
- Costs associated with differences in management.
- Notes about what you did or observed
- Details of all management activities.
- Observations, including weather, any visible differences between the plots, pest or disease outbreaks, etc.
- Photos taken regularly (weekly or monthly).
- Measurements from each plot (keep the raw data, not just averages).
- Dates of management activities, field observations and weather events
Taking notes can seem time-consuming, but it is less work than repeating the study because you can’t remember which plot was which. Frequent observations and notes can lead to new insights you were not expecting.
Yield measurements
Getting useful information from an experiment requires accurate data-collection methods, especially for yield. For crops harvested with a combine, yield monitors can give approximations of yield, but these estimates can be off by 7% or more, and errors can be much higher if you do not calibrate the yield monitor. Yield monitor accuracy is especially poor in crops that must be cleaned or dried before being sold. In grass seed, for example, the amount of cleanout during seed cleaning can vary from treatment to treatment, but a yield monitor would miss those differences. If you use a yield monitor, be sure to calibrate it.
A weigh wagon is a better way to measure yield. For each plot, harvest an area with known dimensions, then transfer the harvested crop into the weigh wagon to measure the weight. Check that the harvest equipment is empty before you harvest your first plot, and empty it between plots. You can get a small sample of the harvested crop from each plot to measure cleanout, moisture or quality. Calculate the area of the plot in acres, then divide the harvested weight by the plot area to get yield.
Interpreting results
Once you have collected your data, you must interpret your results. Even well-designed experiments can produce misleading data if not carefully interpreted. For example, two identical treatments might appear different due to random chance, Likewise, random variability might hide a difference. Researchers often use replication and statistical analysis to understand an experiment’s random variability. When treatments differ by more than expected due to random chance, the difference is “statistically significant.” This means that it is reasonable to conclude that the difference is a real effect of the treatments rather than an artifact of random chance.
Deciding if you found a difference between treatments is an important step in interpreting your results, but common sense is also required. Consider your farm management when interpreting your data. How much better do you need that treatment to perform before you are willing to adopt it on your whole farm? The treatment you tested might cost more or take longer than your control or standard management practice. If a treatment saves money or time, a slight decrease in yield might even be acceptable.
In this section, we examine several hypothetical experiments (Figure 5) and explain the process for interpreting results. This should help you decide if your results show a clear difference between treatments, no difference between treatments, or insufficient information to conclude. We will use the same ideas that statisticians use, but we will not discuss how to do the mathematical calculations used in statistics. To learn more about statistical analysis, check out the resources section or reach out to your county Extension agent.
The average of several replicates is your best estimate for how a treatment performs, so start evaluating your results by averaging the replicates from each treatment. In Figure 5, these averages are shown by the dashed and dotted lines. Next, look at the difference between the averages of the treatments. If you were to test two treatments that did not differ, random chance is likely to produce small differences between the treatment averages in an experiment but less likely to cause big differences.
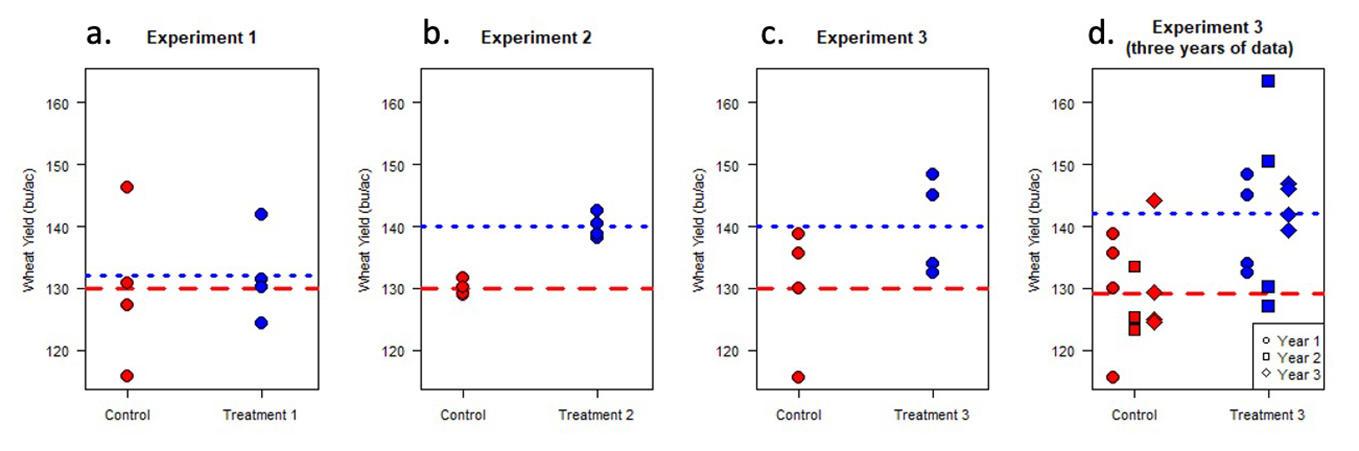
In Experiment 1 (Figure 5a), the average yield of the control plots was 130 bushels, while the average of the treatment plots was 132 bushels, a difference of 2 bushels. This small difference may be a result of random chance. In Experiment 2 (which tested a different treatment, Figure 5b), the control yielded 130 bushels on average, while the average yield of the treatment was 140 bushels, 10 bushels more than the control. The larger difference observed in Experiment 2 is likely caused by a difference between the treatments. It is a large enough difference that the increase in yield could pay for increased input costs.
The next step in analyzing your data is to decide how well the averages you measured in your experiment reflect how the treatments will perform (that is, if you were to use that management across your whole farm for many years). You can do this by looking at the amount of variability between replicates of the same treatment and the number of replicates.
Both Experiment 2 (Figure 5b) and Experiment 3 (Figure 5c) had the same difference between the average of the control and treatment, but the amount of variability was different. In Experiment 2, every treatment plot yielded higher than every control plot — strong evidence that you would see an increase in yield if you adopted the treatment across your farm. Experiment 3 is another story, with the yields from individual plots spread across a wide range. Results like those in Experiment 3 (a meaningful difference between the treatment averages but high variability among the individual plots) indicate that you should gather more data before concluding. Consider repeating the experiment for another year, possibly with more replications. Experiment 1 also has high variability, which combined with the minimal difference between the treatment averages. So, there is little evidence that the treatment had a meaningful effect on yield.
Figure 5d shows the results of Experiment 3 after two more years of data collection. The treatment continued to produce higher average yields than the control in both years, which should increase your confidence in that result. Repeating the experiment essentially increased the number of replications from three to nine. If you have more replicates, variability is less likely to affect the overall average of those replicates, so you can be more confident in the treatment averages than if you had fewer replications.
Key points:
- On-farm experiments can give you confidence about which new or novel practices you should adopt on your farm.
- Choose a field or site for your trial which is uniform and representative of most of your farm.
- When you try a new product or practice, ensure you have a “business as usual” control to compare to.
- Before you begin, ask yourself, “How will I know this new practice is better? What will I look for, and what will I measure?”
- If possible, replicate your treatments and controls so you can be confident that the results you see were caused by the treatments rather than some unknown variability in your field or unexpected pest outbreak.
- Take good notes, use marking flags, and take photographs so you don’t forget the important details.
- These types of on-farm trials can be quite interesting for science-minded Extension agents. They might be able to help with the design, measurements, or interpretation.
Resources and references
Chaney, D. 2017. How to Conduct Research on Your Farm or Ranch. Sustainable Agriculture Research and Education Technical Bulletin.
Colley, M., J. Dawson, J. Zystro, K. Healy, J. Myers, H. Behar and K. Becker. 2018. The Grower’s Guide to Conducting On-farm Variety Trials. Organic Seed Alliance.
Hilshey, B., S. Bosworth and R. Gilker. 2013. A Practical Guide to On-farm Pasture Research. Sustainable Agriculture Research and Education.
Kyveryga, P. M., T.A. Mueller, N. Paul, A. Arp, and P. Reeg. 2015. Guide to On-Farm Replicated Strip Trials. Iowa Soybean Association.
Luck, B.D. 2017. Calibrate Your Yield Monitor for Greater Accuracy During Harvest. University of Wisconsin-Extension publication A4146.
Tarasoff, C. 2016. A Guide to On-Farm Demonstration Research – How to Plan, Prepare and Conduct Your Own On-Farm Trials. British Columbia Forage Council.
Farm Stat – Statistics Calculator for On-farm Trials. University of Nebraska – Lincoln.
Grower’s Guide to On-Farm Research. Nebraska On-Farm Research Network.
Carmer, S.G. and W.M. Walker. 1988. Significance from a statistician's viewpoint. Journal of Production Agriculture, 1(1), 27-33.
Wuest, S.B., B.C. Miller, J.R. Alldredge, S.O. Guy, R.S. Karow, R.J. Veseth, and D.J. Wysocki. 1994. Increasing plot length reduces experimental error of on‐farm tests. Journal of production agriculture, 7(2), 211-215.