Cover crops reduce soil erosion, improve soil tilth, and increase soil biological activity. Legume cover crops maintain nutrient balance in organic cropping systems becasue htey are one of the few organic inputs that supply nitrogen (N) without phosphorus (P) or potassium (K). Cereal cover crops maintain vegetative cover in winter (to reduce soil erosion) and to take up residual soil nitrate-N from the summer crop that might otherwise leach to groundwater. A key benefit of cover crops is their ability to supply plant-available nitrogen (PAN) for the following crop. PAN consists of ammonium-N + nitrate-N. The PAN provided by a cover crop can replace purchased N inputs such as fertilizer, compost, or manure. But to take advantage of this benefit, you need to know how to predict the PAN value of the cover crop. How much PAN is provided? When is PAN provided? What is the best way to predict the PAN-supplying ability of various cover crop species and mixtures?
Publication highlights
- Legume cover crops provide up to 100 lb PAN/a. To maximize PAN contribution from legumes, kill the cover crop at bud stage (early May).
- Cereal cover crops immobilize up to 50 lb PAN/a. To minimize PAN immobilization from cereals, kill the cover crop during the early stem elongation (jointing) growth stage (early April).
- Legume/cereal cover crips mixtures provide a wide range of PAN contributions, depending on legume content. When cover crop dry matter is 75 percent from cereals + 25 percent from legumes, PAN is usually near zero.
- A laboratory analysis for cover crop total N as a percentage in dry matter (DM) is good predictor of a cover crop's capacity to release PAN for the summer crop.
- When cover crops contain a low N percentage (less than 1.5 percent N in DM), they provide little or no PAN.
- When cover crops contain a high N percentage (3 percent to 4 percent N in DM), they provide approximately 25 to 40 lb PAN/ton of dry matter.
- Cover crips decompose rapidly and release or immobilize PAN rapidly. Most PAN is released in 4 weeks after cover crop kill.
- PAN from legume cover crops is usually less expensive than PAN from organic fertilizers.
- Values for cover crop PAN listed here are most applicable to winter cover crop/summer vegetable crop rotations in western Oregon and Washington.
PAN basics
Why cover crop N percentage is a good indicator of cover crop PAN
Cover crops may increase or decrease N fertilizer needs for the following crop in the rotation. Because decomposition happens quickly, so does PAN release or immobilization (negative PAN).
PAN released from a cover crop depends on crop species and crop growth stage. In general, green leafy plant tissues have high N concentrations and high PAN. More mature plant tissues (stems) have low N concentrations and low or negative PAN.
Carbon (C) and N dynamics control PAN release. As soil organisms decompose cover crop residues, a portion of cover crop C is lost from soil (as carbon dioxide). The remaining cover crop C is transformed by the decomposition process, yielding fresh soil organic matter with a C:N ratio of approximately 12:1. For a typical cover crop, 60 percent of cover crop C is lost as carbon dioxide, and 40 percent of cover crop C is incorporated into soil organic matter. Most of this decomposition occurs in the first 4 to 6 weeks after spring plowdown.
Nitrogen percentage in a cover crop is strongly related to PAN release following cover crop incorporation, as illustrated in the conceptual example given in Table 1.
- For legumes (e.g., common vetch) that are high in N, about half of cover crop N is released as PAN because the cover crop has more N than needed to “build” soil organic matter.
- For non-legumes, such as cereal rye, that contain about 2 percent N in dry matter (DM) during stem elongation, the release of PAN is small, because most of the cover crop N goes into soil organic matte
- When cereal crops reach the heading growth stage (1 percent N in DM), PAN is immobilized (made negative) by cover crop decomposition because more N is required to build soil organic matter than is present in the cover crop.
| N fate | |||||
|---|---|---|---|---|---|
| Cover crop (%N in DM) | Growth stage | Biomass DM (lb/a) | Cover crop N uptake (lb/a) | N in soil organic matter (lb/a) | Plant-available N (PAN) NH4 -N + NO3 -N (lb/a) |
| Common vetch (3% N) | vegetative | 3,000 | 90 | 40 | 50 |
| Cereal rye (2% N) | stem elongation | 3,000 | 60 | 40 | 20 |
| Cereal rye (1% N) | heading | 8,000 | 80 | 107 | -27 |
1 Rapid decomposition typically occurs during the first 4 to 6 weeks after cover crop plowdown.
2 Assumptions: Cover crops contain 40 percent C in DM; 60 percent of cover crop C is decomposed (lost as carbon dioxide); all cover crop N is retained (zero N loss); stable soil organic matter has C:N ratio of 12:1
Cover crop roots contribute only a small amount of PAN for the following crop and are ignored in calculations used in this publication. Research conducted in western Washington showed that Austrian pea and hairy vetch cover crops contained approximately 100 lb N/a above ground, but only 10 lb N/a in roots (Kuo et al., 1997). Roots also had low N in DM (%N less than 2 percent; C:N ratio greater than 20), suggesting that PAN release would be near zero.
Other cover crops
Phacelia is sometimes used to replace cereals as a winter cover crop. Like cereals, PAN from phacelia is positive in early vegetative growth, but is near zero or negative at flowering (Luna et al., 2018).
Brassicas provide PAN when killed at flowering growth stage (%N in DM is near 2 percent). Brassica cover crops are atypical in western Oregon vegetable crop rotations because of concerns about cross pollination of Brassica seed crops. Also, Brassica cover crops stimulate soilborne diseases, such as club root, that can infect Brassica cash crops (cabbage, broccoli, turnips, etc.) Mustard (a Brassica species) is used successfully in eastern Oregon potato rotations.
When to kill a winter cover crop to get maximum PAN benefit
PAN from any cover crop is minimal when the cover crop is killed when it is very small (e.g., in March). For solo cover crops, the best time to kill the cover crop to maximize PAN depends on whether the cover crop is a legume or a non-legume.
- PAN from legumes (Figure 1) peaks at budding growth stage (May). PAN declines slowly as reproductive growth continue.
- PAN from cereal residues is positive early in the spring (through tillering, mid- to late March). As stem elongation proceeds (jointing), PAN from cereal residues declines. By the time the flag leaf (uppermost leaf) emerges (Feekes growth stage 8 or Zadoks 37), PAN from cereal crop residue is near zero. When cereal heads are visible (Figure 2), PAN from cereals is negative.


To maximize PAN, kill cereal cover crops early, but wait until bud stage to kill legumes.
In cereal/legume mixtures (Figure 3), the best crop growth stage for maximum PAN benefit depends on the percentage of legume in the stand.
- When the cover crop has mostly legume (75 percent legume line in Figure 4), it behaves much the same as does a pure legume cover crop. However, the PAN from crop residue increases until cereal boot stage (Feekes stage 10; Zadoks stage 45). After cereals reach boot stage, PAN declines.
- When a cover crop has more cereal than legume (25 percent legume line in Figure 4), it follows a similar PAN curve as a solo cereal crop, but negative PAN is usually not seen until the cereal reaches boot stage (around mid-May). A cover crop with at least 25 percent legume can be allowed to grow until early May (boot stage for cereal) without danger of N immobilization (negative PAN).
Seeding legume/cereal mixes instead of a solo cereal crop allows greater flexibility in timing of cover crop kill without consequences of negative PAN.

Estimating PAN
Cover crop N uptake is the total amount of N present in above-ground biomass.Usually, less than half of cover crop N uptake is released as PAN during the first year after incorporation. Figure 5 shows the typical relationship between cover crop N concentration and expected PAN release. Table 2 has the same information in a table format.

| Cover crop N concentration | Plant-available N (PAN) predicted by the OSU calculator | |||
|---|---|---|---|---|
| % total N in dry matter2 | % of total N | lb/dry ton | ||
| 4 wk | 10 wk | 4 wk | 10 wk | |
| 1.0 | -32 | -12 | -6 | -2 |
| 1.5 | -11 | 7 | -3 | 2 |
| 2.0 | 11 | 26 | 4 | 10 |
| 2.5 | 28 | 38 | 14 | 19 |
| 3.0 | 34 | 42 | 20 | 25 |
| 3.5 | 39 | 46 | 28 | 32 |
| 4.0 | 45 | 50 | 36 | 40 |
1 PAN estimated via OSU calculator prediction equations. Source: OSU calculator
2 Obtain cover crop N concentration (on DM basis) from a laboratory analysis report, or estimate cover crop N concentration using the shortcut method.
Example:
You sampled the cover crop using one of the harvest methods and submitted a composite sample of the cover crop to the lab for N analysis. The cover crop biomass you measured was 2 ton DM/a, and the lab analysis was 3 percent N in DM. Using Figure 5 or Table 2, you can see that predicted PAN release from this cover crop is:
- 20 lb PAN/ton DM after 4 weeks
- 25 lb PAN/ton DM after 10 weeks
PAN release per acre is calculated as follows:
PAN (lb/a) = cover crop biomass (ton DM/a) x estimated PAN (lb PAN/ton DM)
Example: 2 ton DM/a x Calculator prediction at 10 weeks (25 lb PAN/ton DM) = 50 lb PAN/a
Applicability of this guide
The field sampling approaches described to determine cover crop N uptake are applicable to a wide variety of cropping systems.
Research to support our recommendations was performed in the Willamette Valley, where cover crops are normally seeded in fall and killed in spring prior to a summer vegetable crop (see appendices for details).
Compared to results in western Oregon, winter cover crops accumulate less N in western Washington at the same calendar date because of the cooler climate, and some popular Oregon cover crops do not survive the colder winters in western Washington.
We expect a strong relationship between cover crop %N and PAN to be found in most locations. However, the timing of PAN release will differ in regions outside of western Washington and Oregon.
Crop residue decomposition rate and accompanying PAN release rate are primarily driven by soil temperature and moisture content. Decomposition proceeds two to three times faster at a soil temperature of 70°F than it does at 50°F. Decomposition proceeds most rapidly when soil is near field capacity, and it slows as soil dries.
Local research has not specifically addressed whether the method of cover crop kill (tillage, herbicide, roller-crimper, mowing) affects PAN. Research from other regions suggests that cover crop kill method does not affect the amount of PAN release, but these practices may affect the timing of PAN release.
Using a site-specific method to estimate PAN
The recommended field sampling and analysis method in this publication is based on a wholeplant above-ground sample from a specified area. The cover crop is harvested from a known area in the field, weighed wet, then subsampled. The subsamples are sent to an analytical lab for determination of cover crop biomass (dry weight) and total N percentage (%N in DM).
Advantages of a site-specific method
- Accuracy of cover crop N “credits” is improved, and N fertilization practices can be fine tuned.
- Accuracy of this method has been documented extensively for winter cover crops harvested from March through May in the Willamette Valley
- A site-specific method is especially useful for mixed cover crop stands
Considerations
- Collecting and weighing four quadrat samples from a field typically requires about an hour of labor.
- Additional time is required to send samples to the analytical lab, enter data, and use the OSU Organic Fertilizer and Cover Crop Calculator or the Worksheet in Table 3.
Supplies needed
- A sampling frame. The frame can be any size (we use 2' x 2' frames) and can be made from metal, PVC pipe, wood, or any other readily available material.
- A scale with about 20-lb capacity and 0.1-lb accuracy
- A sharp knife or sickle (e.g., lettuce harvesting knife)
- About four large paper bags (e.g., grocery bags) for collecting samples
- A small tarp for combining cover crop samples (about 6 x 8 ft)
- A paper lunch bag for submitting the sample to the laboratory
- Blue ice packets for preserving samples during shipment to the laboratory
Step-by-step method
Step 1. Select an analytical lab.
Because you will be collecting perishable cover crop samples, think about shipping details prior to sample collection. Check with your analytical lab to determine shipping options, sample packaging (paper or plastic), analysis cost, and whether the lab will grind the whole submitted sample (see step 5). We recommend working with a laboratory that will dry and grind the whole sample you submit. Grinding the whole sample prior to subsampling for analysis ensures that the lab analyzes a representative sample (a few grams at most) of your cover crop.
Step 2. Select the cover crop sampling areas in the field (quadrats).
It is better to sample a number of representative small quadrats from different parts of the field (Figure 6) than to sample one large area. For most fields, four quadrats will give an adequate estimate of cover crop field weight and species mix. Choose sample areas that represent the species mixture and plant biomass in your field. Record the quadrat area sampled (ft2 ).

Step 3. Harvest the cover crop.
Cut the cover crop, leaving about an inch of stem above ground. Do not harvest small, low-growing weeds, because they typically have adhering soil. Getting soil into a cover crop sample alters its analysis, inflating DM and reducing N percentage.
The best method for harvesting quadrats depends on the type of cover crop stand. Three methods are described below. Any harvest method can be used that gives you a clean plant sample with a known harvest area.
Harvest method A.
Short, upright cover crops can be harvested using a quadrat frame. Work the frame through the canopy to ground level. Sample plants that root within the quadrat (Figures 7 and 8).


Harvest method B.
For tall or trailing cover crops, push down the canopy in one direction and cut through the cover crop lying on the ground (Figures 9–10).


Harvest method C.
Use a sickle-bar mower or similar harvesting equipment to cut a cover crop strip from the field (Figure 11).

Regardless of the harvest method used, combine all of the field cover crop samples in a large bag or container. Clean plastic tubs or bags (at least 10 gal) work well. Avoid crushing or smashing the cover crop into slime. Protect samples from wilting in the sun or getting soaked by rain.
Step 4. Weigh quadrat samples.
Weighing can be done in the field with a tarp, tripod, and hanging scale (Figure 12). When it is not convenient to weigh in the field, you may want to weigh samples under a roof on a platform scale. An accuracy of about 0.1 lb is sufficient.

Step 5. Prepare subsample for laboratory analysis.
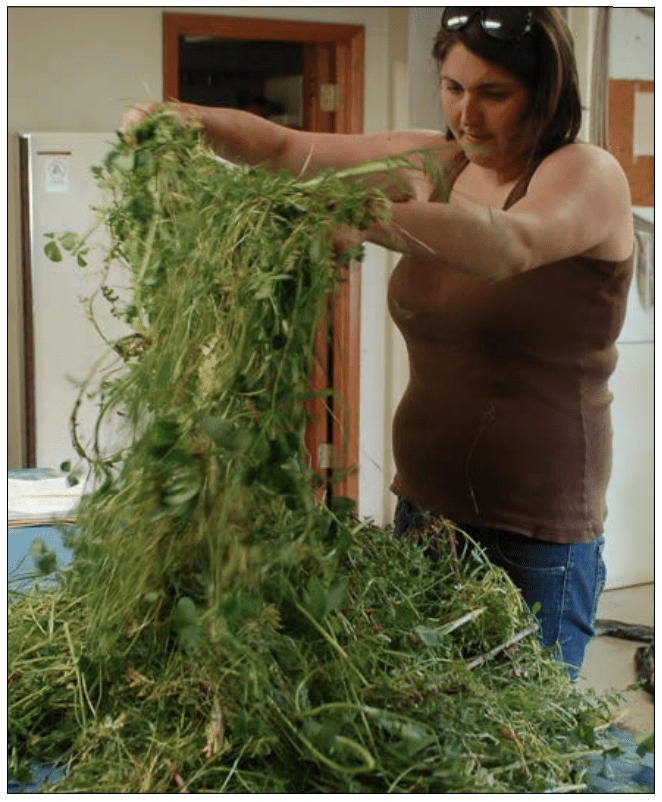
Place the combined field samples on a tarp or clean, flat surface and vigorously mix the sample (Figure 13). Chop or tear apart large plants. When the sample is thoroughly mixed, collect a large handful that fits loosely in a paper bag (half full) and weighs about a pound. This is your lab sample.
It might take a couple of rounds of subsampling to reduce the field sample volume to a 1-gal lab sample volume. If you are not satisfied that you are getting a good mix of species, leaves, and stems, slice the plants into 4- to 6-inch pieces before doing the final subsampling.
Step 6. Ship the sample to the lab for dry matter and total N analysis.
Ship the sample so that the lab receives a fresh plant sample. Ship samples with blue ice to keep sample bags cool in transit, or ship the sample overnight. Generally, it is best to ship the sample early in the week, so it can be processed shortly after arrival.
Step 7. Review laboratory analyses.
Tracking cover crop lab analysis values for multiple fields over 2 or 3 years will help you develop a running average that reflects your management system. After you have consistent data for 3 years of cover crops under your management, you may be able to reduce the frequency of lab analyses.
Step 8. Estimate PAN using Table 3 or OSU Organic Fertilizer and Cover Crop Calculator.
| Line no. | What to measure/calculate | Your value | Example: Vetch | Units |
|---|---|---|---|---|
| 1 | Area sampled to determine cover crop biomass: Quadrat area (ft2) x number of quadrats | 16 | ft2 | |
| 2 | Number of sample areas per acre: 43,560 ft2/acre ÷ Line 1 | 2,723 | sample areas/ acre | |
| 3 | Wet weight of cover crop field sample (lb) | 12 | lb wet cover crop | |
| 4 | Percent DM in cover crop: lab data or your “shortcut” estimate2 | 15 | DM, % in wet cover crop biomass | |
| 5 | Calculate cover crop DM (ton/a): (Line 2 x Line 3 x Line 4 ÷ 100) ÷ 2,000 | 2.45 | ton DM/acre | |
| 6 | Cover crop total N percentage: lab data or your “shortcut” estimate (N, % dry wt)3 | 3.0 | N, % in cover crop DM | |
| 7 | Plant-available N from cover crop decomposition: Find your %N in DM in column 1 of Table 2 or Figure 5 and then find estimated PAN release under the “10 wk” column. | 24 | PAN, lb/ton DM | |
| 8 | Calculate plant-available N for summer crop4 (lb PAN/acre): Line 5 x Line 7 | 59 | PAN, lb/acre |
1The OSU Organic Fertilizer and Cover Crop Calculator calculates PAN (Line 8) from the input data in lines 1–6.
2See sidebar “Shortcut method” and Appendix C. A closed cover crop canopy retains moisture, so cover crop dry matter is relatively consistent across sampling dates.
3See sidebar “Shortcut method.”
4Typical values for PAN are 30 to 70 lb N/a for winter cereal/legume cover crops killed in mid-April (see Case Study 4). Check your calculations if your PAN estimate (Line 8) is greater than 100 lb PAN/a. This is the maximum PAN value observed for excellent vetch cover crops allowed to grow to bud stage (total cover crop N uptake = 150 to 200 lb N/a).
Shortcut method
If you prefer to forego lab analysis, you can harvest and measure cover crop biomass (see steps 1–3 in Table 3) and and use typical values for cover crop DM (step 4 in Table 3) and %N (step 6 in Table 3) to estimate PAN. Values below are typical for cover crops collected in mid-April in the Willamette Valley:
Biomass dry matter:
- Common vetch = 12 to 18 percent
- Cereals = 15 to 20 percent
- 50/50 vetch/cereal mix = 15 percent
%N in DM:
- Common vetch = 3 to 4 percent
- Cereals = 1.5 to 2.5 percent
- 50/50 vetch/cereal mix = 2.5 to 3 percent
The %N in cereals varies with field history. Fields that have a history of manure/compost application and/ or legumes in rotation have higher %N in cereal than do fields with history of only mineral N fertilizer application.
We always recommend cutting and weighing cover crop biomass to estimate PAN. Visual estimates of cover crop biomass are not very accurate, especially for multi-species cover crop mixes.
Case Study 1. Cover crop growth: Is bigger always better?
Situation
May can be rainy in the Willamette Valley, sometimes delaying cover crop kill by several weeks. Data shown below came from a field where cover crops were ready for killing in early May. Because of weather delays, however, the cover crop wasn’t killed until late May.
Question
What is the effect on PAN of delaying cover crop kill until late May?
Method
Cover crop samples were collected on May 5 and May 27 from the same field, and N concentration in the harvested biomass was measured (lb N/ton DM). Crop biomass (lb/a) increased by about 10 to 20 percent between cover crop sample dates.
PAN was determined via incubation of cover crop samples in moist soil in the laboratory. Nitrate-N accumulated in soil was measured after 4 and 10 weeks of incubation at 72°F.
Results
Delaying cover crop incorporation until late May increased N immobilization (negative PAN) for phacelia and cereal rye. Late May incorporation of legume cover crops also reduced PAN substantially (Figure 14).

Recommendation
To get the most PAN value from cover crops, we recommend they be killed during the late vegetative growth stage. In western Oregon, this is often the first window of dry weather after about April 15 (about 2 weeks before bud stage for legumes or boot stage for cereals). The PAN penalty for delaying cover crop kill past bud/boot stage (about May 1) is most severe for cereal cover crops.
Case study 2. Soil testing for nitrate-N to track PAN
If you don’t estimate cover crop PAN by following the method described in this publication, you can use soil sampling to estimate the cumulative effects of the cover crop and soil organic matter on N fertilizer needs.
Most of the PAN released by a cover crop is present in the soil by about 6 weeks after incorporation. Thus, early-season (May/June) soil nitrate sampling can be used to assess N supply for a summer vegetable crop.
Soil nitrate-N above 30 ppm (0- to 12-inch depth) just prior to rapid vegetative summer crop growth is usually sufficient to meet yield goals for vegetable crops (Figure 15). When midseason soil nitrate-N is low, summer vegetable crops may respond strongly to PAN from a winter cover crop (Figure 16). In-season soil nitrate sampling can be used to assess PAN supply in both organic and conventional cropping systems. See EM 9221, Soil Nitrate Testing For Willamette Valley Vegetable Production for details.

Case study 3. Replacing organic fertilizer N with PAN from cover crops
Situation
From the farmer’s viewpoint, the most useful estimate of PAN release from cover crops is a direct field comparison with N fertilizer. Field research to estimate PAN contributed by winter cover crops has been conducted by OSU faculty at on-farm and experiment station fields. Most of the trials used sweet corn as the test crop and compared PAN from cover crops to inorganic N fertilizer. The amount of inorganic N fertilizer replaced by a typical legume or legume/cereal cover crop (grown to midApril) was 50 to 100 lb/a.
Question
What is the organic N fertilizer replacement value of vetch and oat winter cover crop?
Method
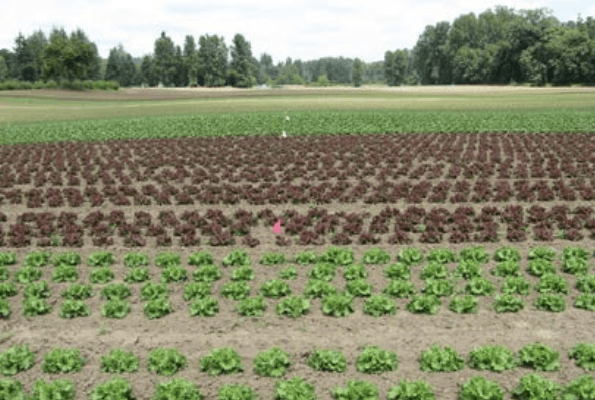
We present data from a trial with organically grown broccoli (Garrett, 2009; Luna et al., 2018) to illustrate the field research approach. This trial was performed with an organic fertilizer, feather meal (12-0-0), as the “grower standard” organic fertilizer.
Winter cover crops (oat, common vetch, or no cover crop) were seeded October 3, 2006 and incorporated by tillage May 12, 2007 when cover crops were flowering (Figures 17–19). Three weeks after cover crop incorporation, broccoli was transplanted into the field. Just prior to transplanting, feather meal was applied in rows at rates of 0, 90, 180, and 270 lb feather meal N/a (0 to 2,250 lb feather meal/a). Broccoli was harvested from August 17 through August 30.


Without a cover crop, broccoli yield increased up to a feather meal rate of 270 lb N/a. To determine the organic fertilizer N replacement value of cover crops, N response curves with and without the cover crop were compared (Figure 20).
Results
The common vetch cover crop (biomass = 4,800 lb DM/a; N uptake = 120 lb/a) replaced about 110 lb feather meal N per acre (Figure 20, left).
The oat cover crop (biomass = 7,050 lb DM/a; N uptake = 40 lb/a) increased N fertilizer need. An extra 50 lb feather meal N/a was needed to compensate for PAN immobilized by oat decomposition (Figure 20, right).

In this trial, PAN release from the vetch cover crop occurred earlier than did PAN release from feather meal, because cover crops were tilled into soil several weeks prior to the feather meal application. The earlier release of PAN from vetch was important in this trial because background soil nitrate-N (without fertilizer or cover crop) was very low (less than 10 ppm nitrate-N at transplanting).
Soil nitrate-N testing, performed 5 weeks after transplanting, showed an extra 45 lb PAN/a with vetch versus no cover crop. The OSU Calculator prediction for PAN from vetch cover crop in this scenario was 46 lb/a. Therefore, PAN from vetch observed in this trial was similar to OSU Calculator predictions.
Recommendations
Oat, as grown in this trial (to boot stage) increased N fertilizer need, while vetch (flowering growth stage) reduced N fertilizer need. To overcome N immobilization by oat, we recommend earlier kill of the solo oat cover crop, or seeding of oat with a legume. Cover crop N from vetch had a high value in the context of this organic farming trial. Feather meal PAN costs about $5 to $6/lb, so the fertilizer cost was reduced by more than $500/a with a vetch cover crop.
Case Study 4. PAN from solo vetch versus mixtures
Situation
Both cereals and legumes provide benefits as a cover crop. Although legumes typically provide more PAN than cereals, adding cereals to a cover crop mix may increase the overall benefit of the cover crop.
Question
Is it more beneficial to seed vetch alone, or with a companion crop?


Methods
On-farm research was conducted at northern Willamette Valley farms in 2009 and 2010 to evaluate a solo vetch cover crop versus species mixtures (cereal rye + common vetch or phacelia + common vetch). The PAN evaluation (reported here) was a part of a broader evaluation of cover crop benefits.
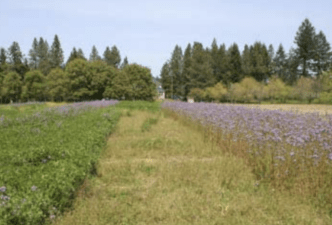
Cover crops were seeded in September or early October. If needed, fields were irrigated to provide moisture to the seedbed. Vetch was seeded at 60 lb/a in mixtures and 70 lb/a solo. Seeding rates of the vetch companion crop (rye at 30 lb seed/a or phacelia at 3 lb seed/a) were low enough to allow successful vetch establishment in the fall (Figure 21).
In spring, cover crop biomass was determined using the site-specific quadrat method (Table 3). Spring cover crop samples were collected April 9 to 30, 2009 and April 15 to May 7, 2010.
Plant-available N (PAN) was determined by incubating chopped cover crop residue in moist soil (20 to 25 percent gravimetric moisture) at 72°F in the laboratory (Figure 22).
Results
Cover crop performance. Cereal rye was a dependable companion to vetch, establishing a stand at all locations. Phacelia established well in the fall, but it winter-killed in four of seven fields, partially smothering the vetch.
Total biomass was similar (3,300 lb DM/a) for solo vetch and phacelia + vetch cover crops. Biomass for rye + vetch was higher on average, at 4,800 lb DM/a
When seeded alone, vetch accounted for 65 to 70 percent of total cover crop biomass, with weeds accounting for the balance. When seeded with rye, vetch averaged 35 percent of total biomass. Vetch biomass was more variable when seeded with phacelia. Weed biomass was lowest with rye + vetch.
PAN from cover crops. Results are shown in Figure 23.
- Nitrogen concentration in cover crops averaged 3 percent N for solo vetch, 2.4 percent N for rye + vetch, and 2.8 percent for phacelia + vetch.
- Plant- available N released from cover crop residues was similar to for solo vetch or mixtures (40 to 70 lb PAN/a after 10 weeks).

Conclusions
- When cover crops are killed on mid-April, mixtures of vetch with rye or phacelia may provide additional benefits (soil erosion protection, weed control) without sacrificing PAN.
- Rye was a more dependable companion crop for vetch than was phacelia.
Appendix A: Using cover crop total N% to predict PAN
Situation
In this publication, we use cover crop %N as a predictor of PAN release (Figure 5 and Table 2). Many other publications use the C:N ratio as a predictor of cover crop PAN. However, because most cover crops contain 40 percent C in DM, the C:N ratio is usually just an indirect way to express crop N percentage. We find %N to be a more useful index of PAN because it yields a linear relationship with PAN, instead of the curvilinear relationship found using C:N ratio.
Question
How do PAN predictions using %N compare to those using C:N ratio?
Method
We collected crop residues from a field site in the northern Willamette Valley on May 5, 2008. To estimate PAN, we added cover crop residues to moist soil for 4 or 10 weeks at 72°F and then measured the accumulated soil nitrate-N.
Results
In Figure 24, cover crop total N (left graph) or C:N ratio (right graph) is plotted versus measured PAN for the same cover crop samples. PAN increased with cover crop N percentage (top), and it decreased with cover crop C:N (bottom). The linear relationship observed with %N as the predictor of PAN (left) is easier to interpret than the exponential relationship of C:N versus PAN (right). “Break-even” or zero PAN at 4 weeks was observed when cover crop N concentration values were 1.7 percent N (left) or when C:N was 24:1 (right).

Appendix B: Typical cover crop dry matter percentages
Situation
Dry matter (DM) is one of the measurements needed to estimate site-specific PAN using our worksheet (Table 3).
Question
How variable is cover crop dry matter among cover crop species and sampling times?
Method
Dry matter percentage in cover crop samples from grower field in the norther Willamette Valley was determined in 2008-2010. Cover crop samples were collected using one of the site-specific methods (Method A or B). More than 50 samples were collected each spring from grower fields just prior to the time of cover crop kill (mid-April to early May). Cereals were in the stem elongation growth stage (April) or near boot stage (early May). Other species were vegetative (April) or starting to flower (early May).
Results
Cover crop DM ranged form 10 to 22 percent, with most samples having 13 to 18 percent, DM. Clover had the lowest DM, and cereals and phacelia had the highest DM.
Conclusion
Dry matter values shown in Table 4 can be used to evaluate whether your values for cover crop dry matter (Table 3) are "typical." These values can aslo be used as rough estimates when cover crop DM is not measured.
The range in DM found in cover crop samples can be large (10 to 22 percent). Site-specific DM measurement is recommended to improve the accuracy of your PAN estimate/
| Year | Cover crop | Number of fields | DM % range | DM % mean |
|---|---|---|---|---|
| Single species | ||||
| 2008 | Cereal (oat, rye, or triticale) | 4 | 16–20 | 18 |
| Clover | 4 | 10–12 | 11 | |
| Phacelia | 2 | 17–22 | 19 | |
| Common vetch | 4 | 13–17 | 15 | |
| Mixtures | ||||
| 2009 | Phacelia + common vetch | 4 | 12–17 | 15 |
| Rye + common vetch | 4 | 14–16 | 15 | |
| Common vetch | 4 | 12–16 | 14 | |
| 2010 | Phacelia + common vetch | 3 | 15 | 15 |
| Rye + common vetch | 3 | 13–19 | 15 | |
| Common vetch | 3 | 13–19 | 15 |
1 Data Source: Nick Andrews (PI): WSARE project FW06-301 and FW09-328.
2 Winter cover crop biomass collected April 16 to May 5, 2008; April 9 to 30, 2009; and April 15 to May 7, 2010. Average biomass yield = 3,800 lb DM/a.
Appendix C: Crop N uptake from diverse legume and non-legume cover crop
Situation
A wide variety of cover crop species is available. Growers would benefit from knowing the typical performance of these species.
Questions
How do various cover crop species compare in DM accumulation, N uptake, and N concentration>
Method
Winter cover crops were evaluated for N uptake in field trials conducted in the mid-Willamette Valley from 1992-1995 (Table 5). Cover crops were seeded in September, then irrigated after seeding. Nitrogen uptake by cover crips was determined in mid-April.
Results
A major factor affecting cover crop biomass and N uptake was the winter hardiness of cover crop species. Crimson clover and the vetches were the most consistent legumes in terms of growth and N uptake. Winter wheat and cereal rye were the most dependable cereal cover crops.
Cereal N uptake was 40 to 70 lb N/a (0.8 to 1.2 percent N in DM), demonstrating that cereal cover crops can recover soil N that would otherwise be leached during winter months. Legume N uptake and fixation was 100 to 150 lb N/a (2 to 3 percent N in DM) for most species.
| 4-year average | |||
|---|---|---|---|
| Cover Crop | Dry matter (ton DM/a) | N uptake (lb/a) | N concentration (% in DM) |
| Non-legume | |||
| Humas rapeseed | 2.5 | 60 | 1.2 |
| micah barley | 1.6 | 50 | 1.6 |
| Annual ryegrass (3) | 2.6 | 40 | 0.8 |
| Monida oats | 2.7 | 50 | 0.9 |
| Stephens winter wheat | 2.7 | 60 | 1.1 |
| Wheeler ceral rye | 3.3 | 70 | 1.1 |
| Juan triticale | 3.6 | 60 | 0.8 |
| Legume | |||
| Fava bell bean | 1.4 | 60 | 2.1 |
| Austria winter pea | 2.0 | 120 | 3.0 |
| Kenland red clover | 2.1 | 100 | 2.4 |
| Woolypod Lana vetch | 2.2 | 150 | 3.4 |
| Karridale subclover (3) | 2.4 | 120 | 2.5 |
| Hairy vetch | 2.5 | 150 | 3.0 |
| Common Dixie crimson clover | 3.2 | 120 | 1.9 |
1 Adapted from: Sattell et al., 1999, OSU Extension Service publication EM 8739.
2 Cover crops were seeded in mid-September and irrigated after seeding. Dry matter and crop N uptake were measured in mid-April of the following year.
3 Three-year average, 1993–1995.
For more information
- Andrews, N. and D. Sullivan. 2010. Organic Fertilizer and Cover Crop Calculator. Oregon State University Extension Service.
- Burket, J., D. Hemphill and R. Dick. 1997. Winter cover crops and nitrogen management in sweet corn and broccoli rotations. HortScience 32:664–668.
- Burket, J., J. Sandeno, D. Hemphill, and R. Dick. 2003. Cover Crop Nitrogen for Summer Vegetable Crops. Oregon State University Extension Service. EM 8803-E.
- Clark, A. (ed.). 2007. Managing Cover Crops Profitably (3rd edition). Handbook Series Book 9.
- Garrett, A. 2009. Improving nitrogen management with cover crops in organic broccoli production. M.S. thesis. Oregon State University, Corvallis, OR.
- Kuo, S., U. Sainju, and E. Jellum. 1997. Winter cover cropping influence on nitrogen in soil. Soil Sci. Soc. Am. J. 61:1392–1399.
- Lawson A., C. Cogger, A. Bary and A. Fortuna. Influence of Seeding Ratio, Planting Date, and Termination Date on Rye-Hairy Vetch Cover Crop Mixture Performance Under Organic Management. 2015. PLoS ONE 10(6): e0129597.
- Lawson, A., A. Fortuna, C. Cogger, A. Bary, and T. Stubbs. 2012. Nitrogen contribution of rye–hairy vetch cover crop mixtures to organically grown sweet corn. Renewable Agriculture and Food Systems.
- Luna, J., D. Sullivan, A. Garrett, and L. Xue. 2018. Cover crop nitrogen contribution to organic broccoli production. Renewable Agriculture and Food Systems. 1-10.
- Sattell R., T. Buford, H. Murray, R. Dick, and D. McGrath. 1999. Cover Crop Dry Matter and Nitrogen Accumulation in Western Oregon. Oregon State University Extension Service. EM 8739.
- Sattell, R. (ed.). 1998. Using Cover Crops in Oregon. Oregon State University Extension Service. EM 8704.
- Smith, R., R. Bugg, and M. Gaskell. 2011. Cover Cropping for Vegetable Production. University of California. Publication 3517. ISBN-13: 978-1-60107-679-3.
- Sullivan, D.M., N. Andrews, A.L. Heinrich, R.E. Peachey, L.J. Brewer. 2019. Soil Nitrate Testing for Willamette Valley Vegetable Production. EM 9221.
- Sullivan, D.M., N. Andrews, C. Sullivan, L.J. Brewer. 2019. OSU Organic Fertilizer & Cover Crop Calculator: Predicting Plant-available Nitrogen, EM 9235.
- Sullivan, D. M., R.E. Peachey, A.L. Heinrich, L.J. Brewer. 2017. Nutrient Management for Sustainable Vegetable Cropping Systems in Western Oregon. EM 9165.
- Sullivan, D.M., E. Peachey, A. Heinrich, and L.J. Brewer. 2020. Nutrient and soil health management for sweet corn (western Oregon). EM 9272.
- Wayman, S. C. Cogger, C. Benedict, I. Burke, D. Collins, and A. Bary. 2014. The Influence of Cover Crop Variety, Termination Timing, and Termination Method on Mulch, Weed Cover, and Soil Nitrate in Reduced-Tillage Organic Systems Renewable Agric Food Sys.
- Wayman, S., C.G Cogger., C. Benedict, D.P. Collins, I Burke, and A.I Bary. 2015. Cover Crop Effects on Light, Nitrogen, and Weeds in Organic Reduced Tillage. Agroecology and Sustainable Food Systems, 39:647-665.
Research timeline
Oregon
1990s. Richard Dick and graduate students (Burket, Sattell, and others) conducted cover cropping trials in the Willamette Valley and investigated the N contributions of cover crops to summer vegetables. Some of this research was reported in OSU Extension publications EM 8803-E and EM 8739.
1993–2009. John Luna conducted on-farm cover crop research with Willamette Valley vegetable growers. Findings were published in reports to the Oregon Processed Vegetable Commission. Luna and graduate student Amy Garrett conducted field trials to study N management in organic broccoli using legume and non-legume cover crops in 2007–2008, publishing results in Garrett’s M.S. thesis.
2007–2011. Nick Andrews and Dan Sullivan conducted lab and field research to estimate PAN from cover crops. Field trials were maintained by Kristin Pool, and lab incubations were conducted by graduate student RonJon Datta. Key data from those trials are reported in appendices of this publication. Data from this research were used to support development of cover crop PAN predictions within the OSU Organic Fertilizer and Cover Crop Calculator
2019-2020. The equation for prediction of cover crop PAN was revised by Dan Sullivan, as described in EM 9235. A revised Excel version of the Calculator consistent with equations given in EM 9235 is posted online.
Washington
1990s. Shiou Kuo and collaborators conducted trials at Mt. Vernon and Puyallup evaluating winter cover crops. A number of research articles were published by Kuo and collaborators on cover crop effects on soil quality and N.
2000s. Craig Cogger and collaborators conducted trials at Puyallup and other locations in western Washington to evaluate cover crops in the context of organic cropping systems. Publications by that group are listed in “For More Information.”
Acknowledgments
We appreciate careful and thoughtful review comments from Scott Latham, Sauvie Island Organics; David Brown, Mustard Seed Farms; Lee Ko, NRCS-Clackamas County; Craig Cogger and Doug Collins, WSU-Puyallup; Dean Moberg, NRCS-Washington County; John Luna and Amy Garrett, OSU; and Kristin Pool, Morgan Curtis, John Yeo, and Sarah Wright, OSU graduate research assistants.
We are also grateful to the farmers who hosted our cover crop trials, including David Brown, Mustard Seed Farms; Scott Latham and Shari Raider, Sauvie Island Organics; Joe Siri, Siri & Son Farms; Jim Bronec, Praying Mantis Farm; Jeff Boden, West Union Gardens; Anthony Boutard, Ayer’s Creek Farm; Laura Masterson, 47th Avenue Farm; and Jim Hinsvark, Hinsvark Farm.
Financial support for cover crop trials (2007–2011) was provided by grants from Western Sustainable Agriculture Research and Education, a partnership with Oregon Tilth, Inc., and the Oregon Organic Cropping Research Special Grant (USDA-NIFA).
About the authors

© 2020 Published and distributed in furtherance of the Acts of Congress of May 8 and June 30, 1914, by the Oregon State University Extension Service, Washington State University Extension, University of Idaho Extension and the U.S. Department of Agriculture cooperating. The three participating Extension services offer educational programs, activities and materials without discrimination on the basis of race, color, national origin, religion, sex, gender identity (including gender expression), sexual orientation, disability, age, marital status, familial/ parental status, income derived from a public assistance program, political beliefs, genetic information, veteran’s status, reprisal or retaliation for prior civil rights activity. (Not all prohibited bases apply to all programs.)