More than 1,500 species and cultivars of bare-root shade and flowering trees are grown in the Willamette Valley. To ensure that trees reach a desired grade within an acceptable period of time, they must be adequately supplied with nutrients and intensively managed through root and shoot pruning.
This guide can serve as a starting point for the development of nutrient management guidelines for Oregon growers. Recommendations in this guide are based on research performed in the Willamette Valley with other cropping systems and on current nutrient management practices of bare-root shade tree growers.
Shade and flowering trees grown in Washington, Multnomah, Clackamas, Yamhill, Marion, Polk, Benton and Linn counties are sold throughout the United States.
This growing region receives, on average, 35 to 40 inches of annual precipitation, most of which falls from November through April. Soil textures range from sandy loam to clay loam.
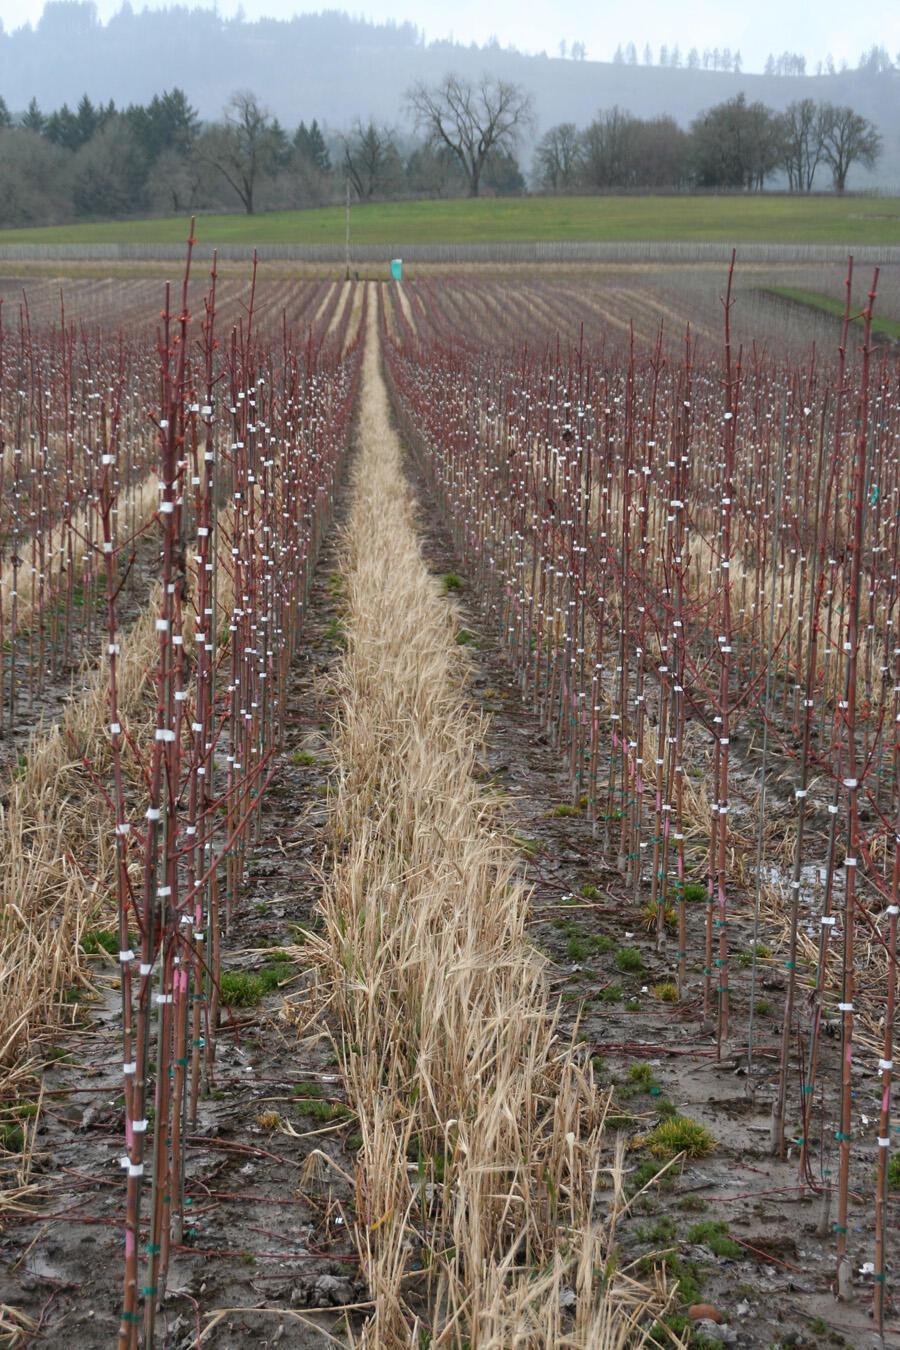
Ornamental and fruit trees are grown from tissue culture plantlets or grafted onto rootstock. In almost all cases, trees are grown from a single bud occurring on a 1-year-old liner. This bud is grown into a whip or branched tree over a one- to four-year production cycle (Figure 1).
Shade or flowering trees have one to three growth flushes, continuous or episodic, to produce a 4- to 8-foot whip or branched tree of 3⁄4- to 2-inch caliper. Shade tree quality and grade are based on height, caliper, root structure and branch structure or tree form. Consumers judge trees based on aesthetics at the time of purchase; therefore, a uniform shape, quality roots and acceptable color are necessary to produce a marketable product.
Soil physical factors such as depth, texture, water-holding capacity and drainage affect the soil’s ability to store and supply nutrients for tree production. These factors are the result of inherent soil characteristics and of recent management practices such as equipment traffic, tillage and crop rotation. Soil maps, available from the Natural Resources Conservation Service or private consultants, provide site-specific soil information. Practices that improve soil physical condition encourage greater root development, thereby increasing nutrient uptake.
The recommendations in this guide for application of soil amendments (for pH adjustment) and immobile nutrients are based on a preplant soil test (0–12 inch depth). Collect a composite soil sample consisting of 20 or more soil cores from each management unit (field or portion of a field that can be fertilized separately). Soil test interpretations in this guide are valid only when the soil testing lab performs tests following the analysis procedures given in Tables 1, 2, 3 and 5).
Timing of nutrient application
The goal of nutrient management is to match crop need or uptake with the supply of readily available nutrients in the soil solution. Decisions about timing of nutrient application are based on the mobility of plant-available nutrient forms in soil.
Soil amendments to adjust pH
The target pH for most shade tree species grown in the Willamette Valley is 5.5 to 6.5. If needed, soil pH can be raised by liming (to reduce acidity) or reduced by elemental sulfur application (to increase acidity). These amendments are slow-acting and immobile; therefore, they must be applied before planting and tilled into the soil.
Immobile nutrients
Most nutrients (phosphorus, potassium, calcium, magnesium and most micronutrients) do not move readily in the soil. Supply of these nutrients is assessed by preplant soil testing. Fertilizers supplying these nutrients are most effective when applied and incorporated by tillage before planting. Preplant nutrient application rates given in this guide are considered adequate for a two- or three-year production cycle. After planting, subsequent applications of these nutrients (top-dress or fertigated) affect only a small volume of soil near the application site.
Mobile nutrients
Plant-available forms of N and S — nitrate-N (NO3) and sulfate-S (SO4) — move readily through the soil with rain and irrigation water. Recommendations for these nutrients are based on annual plant uptake needs, not on soil test data. Apply N and S fertilizers each year to meet crop needs.
Nitrogen
N sources
Nitrogen is supplied to trees from the soil, irrigation water, conventional fertilizers, manure, compost and crop residues. Conventional fertilizers such as urea provide readily available forms of N and are used in the Willamette Valley to supply N for ornamental tree production. To date, slow- and controlled-release N products have not been shown to be advantageous to conventional fertilizer products under Willamette Valley conditions.
N rate
Based on grower experience and research results, annual application of 120 lb N/a is usually adequate to produce high-quality trees.
Timing of N fertilizer application
Most growers apply N in two or three applications that occur during late winter (February to April) and spring (May to June). Split, or multiple, applications of N fertilizer ensure an adequate amount of available N throughout the growing season. Dividing the applications of N fertilizer is most beneficial on sandy, excessively drained soils (NRCS Hydrologic Class A) and on poorly drained soils (Hydrologic Class D). Both of these soil types are highly susceptible to N loss. On Class A soils, N is lost via leaching. On Class D soils, N is lost via tile drains, runoff and denitrification.
Method of N fertilizer application
Most growers apply N by broadcasting (aerial or tractor spreader). For broadcast application, Willamette Valley nursery growers typically apply no more than 60 lb N/a in one application.
In-row fertilizer application can be used to produce high-quality trees with lower N fertilizer application rates. With in-row application, the goal is to fertilize only the root zone of the trees, leaving the area between rows unfertilized. N fertilizer can be delivered to the row via banding, side-dressing or fertigating.
With in-row fertilization, the N fertilizer application rate is reduced proportionally based on the fraction of the field represented by the root zone. For example, if you want to apply 100 lb N/a, but the root area (as determined by root pruning, harvesting equipment and inter-row cultivation) is equal to half of the total field acreage, you can reduce the application rate from 100 lb/a to 50 lb/a and still get the expected tree growth response.
Regardless of application method, N fertilizer applied in a dry form should be accompanied with water to move the fertilizer into the root zone and prevent N loss to the atmosphere.
Evaluating N fertilizer management
This publication gives only general guidance for N management. You can evaluate the effectiveness of your N fertilizer program through targeted testing in your own fields. For example:
- Try withholding N fertilizer from some plots; compare tree growth and quality to that of trees treated with your “normal” fertilization program.
- Monitor soil nitrate-N in selected fields to refine N fertilizer rates.
Soil nitrate test interpretation depends on sampling location (in-row or between rows) and time of sampling (early season or late season).
Sampling location
Monitor soil nitrate in productive portions of the field, avoiding gravel bars and other atypical areas. To get the best information, we suggest collecting separate soil samples from between rows and within rows.
- Nitrate-N samples taken within rows measure N currently available to tree roots.
- Soil nitrate-N testing between rows is not recommended when N fertilizer is broadcast or if grass or cover crops are planted between rows. When N fertilizer is applied only in-row, soil nitrate-N samples taken from the unfertilized area between rows can be used to estimate N contributed from non-fertilizer N sources, such as compost or cover crops.
Time of sampling
- In April–June, soil nitrate tests can be used to determine the need for additional midseason N fertilizer application.
- In August–September, test soil to determine whether the total N supply (from irrigation water, soil and fertilizer) was excessive.
How to sample
- Collect at least 15 cores to a depth of one foot using a soil probe.
- Combine cores in a sturdy plastic or plastic-lined bag, and submit the composite sample to the lab for analysis. Keep the sample cool and ship to the lab via next-day delivery. If sample results are not needed immediately, samples can be frozen and shipped later.
Phosphorus
Phosphorus is immobile in the soil profile. Fertilizers such as superphosphates, ammonium phosphates or other blended fertilizers are commonly top-dressed and incorporated between cropping cycles. Use Table 1 to estimate P rate.
Potassium
Potassium is usually top-dressed and incorporated between cropping cycles. Soil K is not used in great quantities by trees and does not decrease rapidly during a cropping cycle. Use Table 2 to determine K rate.
Potassium can be applied as potassium chloride (KCl), which also provides the essential element chloride (Cl). Chloride is believed to reduce shoot tip dieback and increase crop water status.
Soil pH adjustment
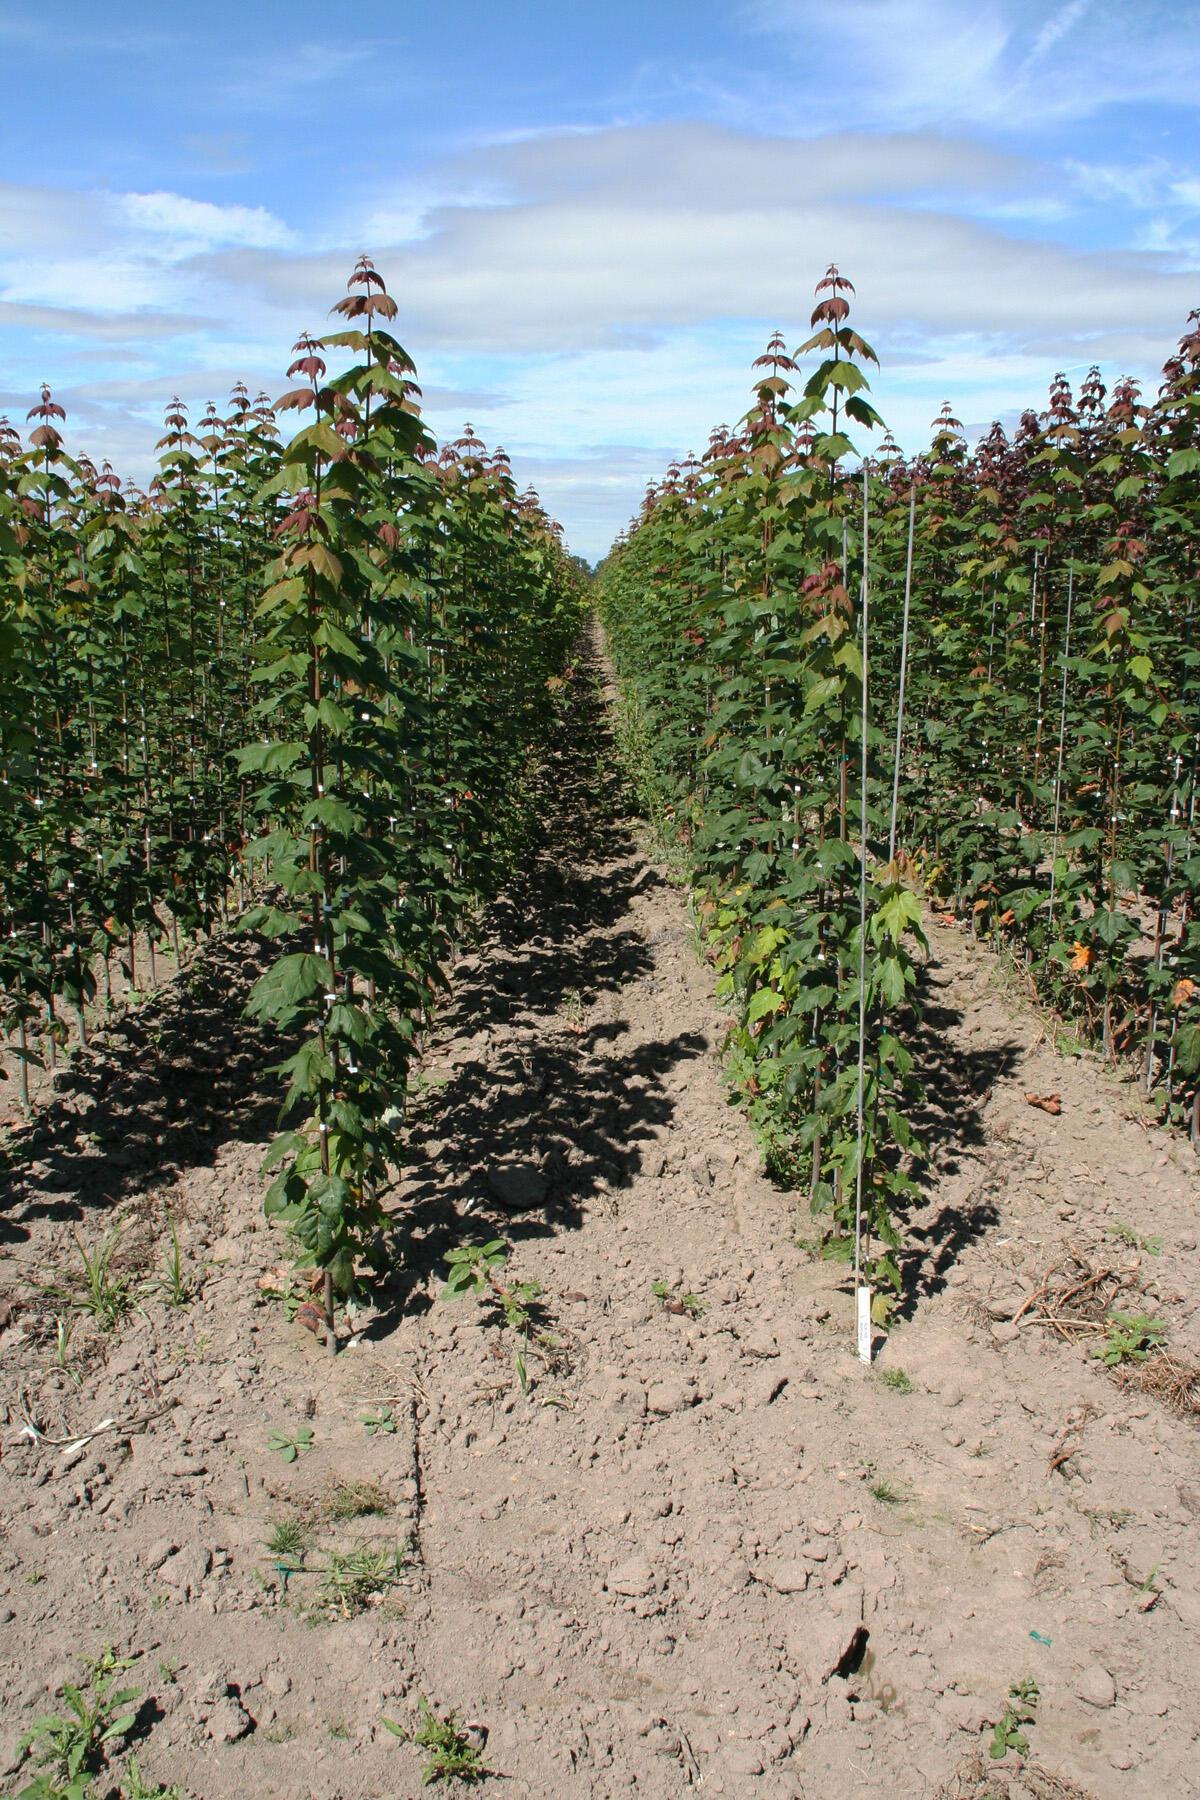
Acidity, or pH, is the most commonly measured chemical characteristic of soil. Soil pH indicates the chemical condition roots will experience. Soils in western Oregon are naturally acidic (low pH); thus, for most crops, liming to raise soil pH is necessary. However, most shade tree species produced in the Willamette Valley grow best in moderately acidic soil (pH 5.5 to 6.5). Some nursery crops, such as azaleas, rhododendrons and red maple (Figure 2), require more acidic soil (lower pH). For these species, reduction of soil pH (acidification) may be necessary.
|
Soil test P (ppm) |
Should you apply P |
Apply this amount of P2O5 (lb/a) |
|---|---|---|
|
Below 20 |
Yes | 100–125 |
|
20–35 |
Maybe | 60–100 |
|
Over 35 |
No | None |
|
Soil test K (ppm) |
Should you apply K? |
Apply this amount of K2O (lb/a) |
|---|---|---|
|
Below 100 |
Yes | 150 |
|
100–200 |
Maybe | 0–150 |
|
Over 200 |
No | None |
As a shade tree producer, your goal is to maintain soil pH in the desired range throughout the crop production cycle (two or three years). Soil pH can be reduced by application of elemental sulfur (S) or increased by adding lime. Soil pH adjustments should be made before planting.
One to two years are required for elemental S or lime to fully react with soil, although most of the reaction takes place during the first year. Even if measured soil pH does not change immediately, the practice is a benefit to trees during the first year following application.
Determining whether pH adjustment is needed
Laboratory determination of soil pH will tell you whether pH adjustment is needed. Collect soil samples for pH analysis before planting. Compare the current soil pH to your target pH for the tree species and cultivar grown. Keep in mind that soil pH typically changes by 0.3 to 0.5 unit seasonally. It is lowest (most acidic) in late August and September, before the fall rains begin and highest in February or March, when the soil is wettest.
Soil pH also decreases from use of ammoniacal N fertilizer such as urea. Soil pH in the surface 2 to 3 inches declines about 0.1 unit/year for each 100 lb ammoniacal N/a. If you apply 100 lb N/a as urea each year, you should expect soil pH to decrease 0.3 unit in a 3-year tree production cycle.
The type of N fertilizer used influences the rate of soil acidification. Fertilizers that supply all of the N in the ammonium (NH4) form, such as ammonium sulfate (21-0-0), acidify soil the most. Ammonium sulfate is twice as acidifying as urea (46-0-0) and urea-ammonium nitrate (Solution 32; 32-0-0) when the same rate of N is applied. Calcium ammonium nitrate (17-0-0) is less acidifying than urea. Calcium nitrate (15.5-0-0) does not acidify soil.
Raising soil pH
Lime is used to raise soil pH (reduce acidity). The lime requirement test (SMP buffer test) estimates the quantity of lime needed to increase soil pH, as shown in Table 3 (page 5). For example, if the SMP buffer test result is 6.2 (left column) and the target pH for your tree species is 6.4, the recommended lime rate (100-score limestone) is 3.2 t/a. Note that although Table 3 provides guidelines, seasonal soil pH changes and variability of soil in a field make the increase in soil pH from lime application difficult to measure.
Two lime materials are available in western Oregon — calcitic (agricultural) lime and dolomitic limestone. If soil test Mg is less than 100 ppm (0.8 meq/100 g soil), use dolomitic lime for 1 t/a of the lime requirement. If the SMP buffer test for lime recommends more than 1 t/a, add the remaining lime as calcitic lime.
|
Desired soil pH |
||||
|---|---|---|---|---|
|
SMP buffer value |
5.3 | 5.6 | 6.0 | 6.4 |
|
Lime requirement t/A) |
||||
|
6.7 or above |
None | None | None | None |
|
6.4 |
None | None | 1.1 | 2.2 |
|
6.2 |
None | None | 1.1 | 2.2 |
|
6.0 |
1.0 | 1.7 | 2.9 | 4.2 |
aAmount of 100-score lime to apply per acre to reach the target pH in the surface 6 inches of soil
Reducing soil pH
Elemental S is used to acidify soil (reduce pH). No soil test exists to determine S rate. The amount of S required to reduce soil pH is a function of soil buffering capacity (resistance to pH change). The quantity of S needed to reduce soil pH increases with soil buffering capacity.
Willamette Valley soils differ in buffering capacity (Table 4). Sandy, low organic matter soils (such as Newberg) have the lowest buffering capacity. The highest buffering capacity is found in soils with high clay and organic matter content (such as Bashaw). Newberg soil (low buffering capacity) requires about half as much S as Bashaw (high buffering capacity) to achieve a one-unit change in pH.
Calcium and magnesium
Calcium soil test values above 1,000 ppm (5 meq/100 g soil) are sufficient. Magnesium is considered to be sufficient when soil test values are above 100 ppm (0.8 meq/100 g soil).
Soils with pH above 5.5 typically have sufficient Ca and Mg. In the case of lower pH soils, the lime that is added to raise pH also satisfies the need for Ca and Mg. Each ton of 100-score lime (calcium carbonate) supplies approximately 2 meq Ca/100 g soil (400 ppm Ca) when incorporated to a 6-inch depth. One ton of dolomitic lime supplies approximately 1 meq Mg/100 g (120 ppm) and 1 meq Ca/100 g (200 ppm).
Only in rare circumstances is Ca or Mg needed when the soil pH is above 5.5 and lime will not be applied. In this case, use the following guidelines:
- If soil test Ca is less than 1,000 ppm (5 meq/100 g soil) or crops are symptomatic (distortion or chlorosis of new growth), 500 lb gypsum/a (calcium sulfate, CaSO4) can be applied to supply Ca. Calcium is also supplied when N is applied as calcium ammonium nitrate (27-0-0) or calcium nitrate (15.5-0-0).
- If soil test Mg is less than 100 ppm (0.8 meq/100 g soil), apply 15 to 30 lb Mg/a. When Mg and soil acidification are needed, apply Mg as Sul-Po-Mag (potassium sulfate + magnesium sulfate) or K-Mag (potassium sulfate). Do not apply dolomitic lime when soil acidification is needed.
|
Typical soil |
Elemental S required to reduce pH from 6.5 to 5.4 (lb/a) |
|---|---|
|
Low soil buffering capacity |
|
|
Newberg |
1,200–1,500 |
|
Medium soil buffering capacity |
|
|
Chehalis, Woodburn, Sauvie, Dayton, Laurelwood, Malabon, Powell and Willakenzie |
1,600–2,000 |
|
High soil buffering capacity |
|
|
Jory, Nekia, McBee |
2,300–2,800 |
|
Very high soil buffering capacity |
|
|
Bashaw, Salem, Amity |
2,500–3,000 |
Adapted from Acidifying Soil for Crop Production (Western Oregon), EM 8857-E
Sulfur
Sulfur can be supplied by irrigation water, fertilizers and from decomposition of organic matter. Soil tests provide little information on soil S status or availability. To ensure adequate S, apply at least 20 lb S/a annually. Common S sources include gypsum (CaSO4) and fertilizers containing sulfate, such as ammonium sulfate [(NH4)2SO4] and K-Mag.
Sulfur can be supplied during the cropping cycle as part of a liquid fertilizer or top-dress application. (See the sidebar “P, K and S adjustment after planting,” page 3, for information about S deficiency symptoms.) S moves into soil with irrigation or rain. Note: Sulfate forms of S do not acidify soil. (See “Reducing soil pH” for information on soil acidification.)
Micronutrients
Shade trees require few micronutrients, and deficiencies of these elements are rare. When deficiency symptoms are observed, they likely are due to a soil pH that is too high for the species being grown.
Micronutrients fall into three catagories:
- Those that merit no concern (copper and molybdenum). These elements are not discussed below.
- Those that are best handled with soil pH modification (iron and manganese).
- Those that can be added through fertilization (boron and zinc).
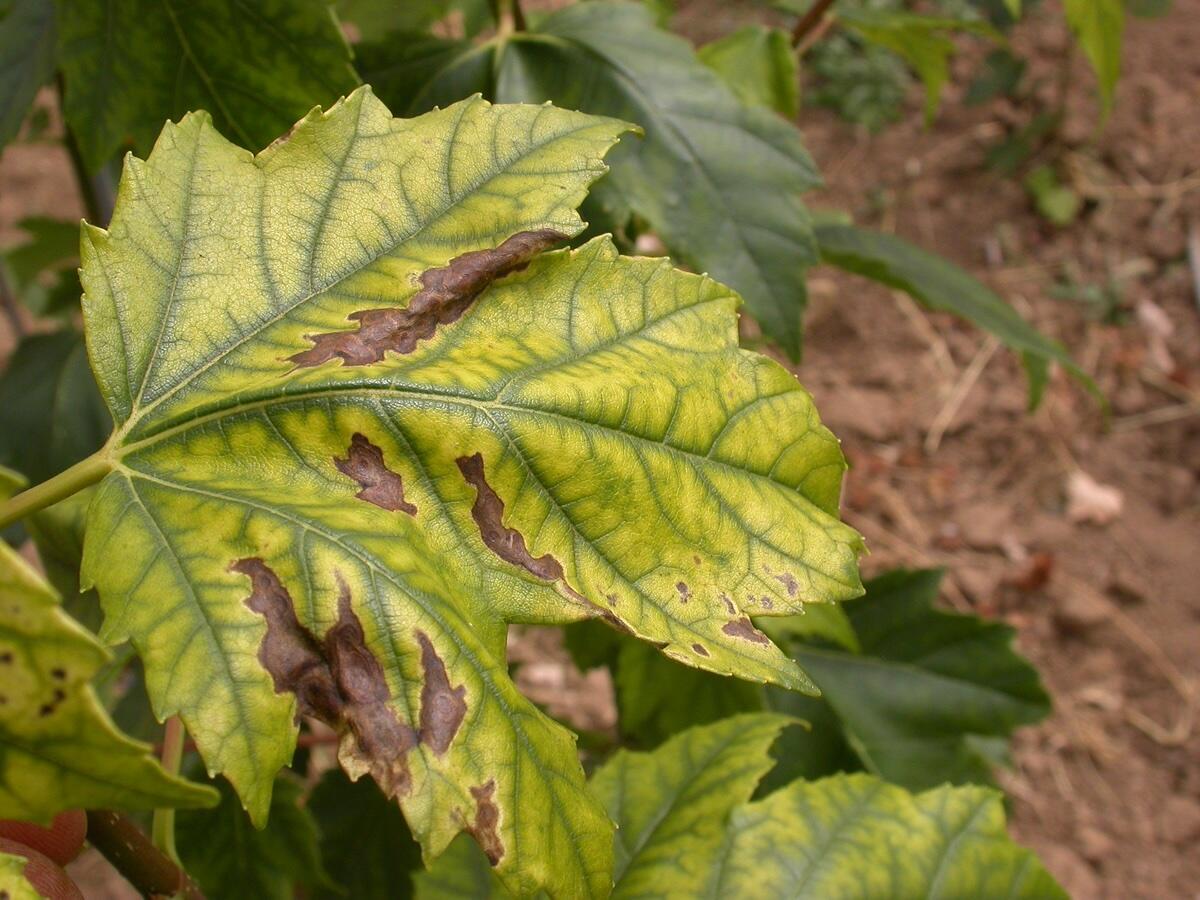
Manganese and iron
Soil tests alone are not good indicators of deficiency of these micronutrients. Species grown, soil pH and soil drainage must also be considered. Leaf symptoms (Figure 3) are a good indication of need.
Iron (Fe) and manganese (Mn) are very difficult to supply via fertilization because soil pH controls availability to the plant regardless of nutrient applications to the soil. Chelates act as a slow-release source and may be of some benefit. Foliar applications may or may not be beneficial. Thus, the key to solving deficiencies of these nutrients is to reduce soil pH.
Zinc and boron
Zinc (Zn) and boron (B) can be added to the soil for shade tree production if soil test values are below the threshold levels in Table 5. Zinc applications should be based on a soil test. When DTPA extractable Zn falls below 1 ppm, apply 5 to 10 lb Zn/a. Zinc applications are needed at most once in a rotation.
Boron is easily leached out of soil with winter rains or irrigation. Soil test B rarely exceeds the 1 ppm threshold given in Table 5. However B is stored in the plant and tissue levels usually are adequate (20 ppm) even when soil levels are low. Apply B once early in a rotation at a rate of 0.5 to 1 lb/a. Do not band B, as some species are sensitive to high soil B levels.
|
To convert column 1 into column 2, divide by: |
Column 1 |
Column 2 |
To convert column into column 1, multiply by: |
|---|---|---|---|
|
390 |
ppm K | meq K/100 g soil | 390 |
|
200 |
ppm Ca | meq Ca/100 g soil | 200 |
|
121 |
ppm Mg | meq Mg/100 g soil | 121 |
|
1 |
meq/100 g soil | cmol/kg soil | 1 |
|
2a |
lb/acre (7-inch depth) | ppm | 2a |
|
3.5a |
lb/acre (1-foot depth) | ppm | 3.5a |
|
43.56 |
lb/acre | lb/1,000 sq ft | 43.56 |
|
43,560 |
square feet | acres | 43,560 |
|
2.471 |
acres | hectares | 2.471 |
|
2.29 |
P | P2O5 | 0.437 |
|
1.20 |
K | K2O | 0.830 |
aConversion factor given assumes typical soil bulk density (1.3 g/cm3 or 80 lb/ft3)
Related publications


