For decades, Oregon State University Extension and other state Extension services have published guidance on the costs of production for different crop and livestock enterprises. These “enterprise budgets” can be useful as financial benchmarks for producers as they manage production costs on their own farms. They can also provide lenders and others in the supply chain a better understanding of the profitability of agricultural production.
However, crop and livestock budgets rarely include the costs that farms face in complying with local, state and federal regulations, which have increased significantly in recent years for some crops.

Crop and livestock budgets rarely include the costs that farms face in complying with regulations.
Regulatory requirements related to safety training, pesticide use and reporting, food safety, the H2A guest worker program, excessive heat, air and water quality, workers’ compensation, and unemployment insurance have added to production costs in meaningful ways.
This publication analyzes the cost of regulatory compliance on four Oregon tree fruit operations and provides guidance for other farms to effectively plan for and manage costs related to regulations on labor, the environment, and consumer safety. We present in-depth data from two pear producers and two cherry producers, which allows us to highlight differences in labor requirements and production practices across these tree fruit crops.
|
Crop |
Operation |
Approximate acreage |
Year-round staff |
Seasonal staff |
Workers per acre |
|---|---|---|---|---|---|
|
Cherry |
Large | 2,500 | 50 | 900 | 0.45 |
| Small | 200 | 6 | 110 | 0.70 | |
|
Pear |
Large | 600 | 35 | 85 | 0.22 |
| Small | 50 | 5 | 20 | 0.54 |
For each crop, we include data from one smaller farm managed by a farm owner with a small number of year-round orchard staff and one larger operation that employs more production staff as well as employees who handle administrative duties (Table 1). Including both large and small farms allows us to explore how compliance costs tend to scale with farm size and the degree to which large farms achieve efficiencies of scale in regulatory compliance.
Compliance costs are separated into cash costs and noncash costs. Cash costs represent employee wages, supplies, and other purchased materials needed to comply with state and federal regulations. Noncash costs include time spent by owners to carry out regulatory tasks that is not directly compensated through payroll expenditure.
Data collection
In the summer and fall of 2024, we identified tree fruit producers that would be willing to participate in lengthy interviews about the actions that they or their employees undertook to comply with state and federal regulations.
We gathered information on farm operations, including the number of employees and their hourly wages, scale of production and typical farm revenues, and asked farm owners about their practices related to farmworker hiring, housing, and training. Farm owners provided information on cash expenses and capital investments related to regulatory compliance.
Prior to the interview, each organization was provided with the same fillable form asking them to document costs associated with compliance categories. We divided regulations into the following categories:
- Safety education and training (for example, Oregon Heat Rule training)
- Air quality requirements (for example, procuring a burn permit)
- Water quality requirements (for example, well water testing)
- Pesticide regulation (for example, filing paperwork and recordkeeping)
- Food safety and produce rule (for example, sanitization of equipment)
- Labor health and safety regulations (for example, water provisioning to comply with the Oregon Heat Rule)
- H2A compliance (for example, H2A application and travel expenses)
- Capital investments required for regulatory compliance (for example, improvements to worker housing to comply with the Oregon Heat Rule)
- Other
Results
Compliance costs are separated into categories to help compare similar costs across farms. Table 2 presents the per-acre cost associated with each category for each of the case-study farms.
The per-acre costs are calculated using the number of acres currently in production and omit fallowed land, farmland used for other crops, and orchard acres that are not yet of productive age. In total, we calculate the cost of regulatory compliance on these farms to range from roughly $250 per acre to more than $700 per acre.
The two pear farms have higher compliance costs than cherry farms, driven by higher safety training costs, labor health and safety, and H2A compliance costs.
The total regulatory costs and the costs for individual categories differ significantly from one farm to the next. This is not surprising given the differences in farm size, number of employees, and management practices on different operations. Still, there are a number of trends that we have found during the interviews with these producers and analysis of their self-reported expenses.
|
Compliance category |
Large cherry |
Small cherry |
Large pear |
Small pear |
|---|---|---|---|---|
| Safety training | $27.28 | $49.21 | $102.16 | $107.73 |
| Air quality requirements | $0.43 | $0.29 | $0.22 | $3.31 |
| Water quality requirements | $0.74 | $2.20 | $8.82 | $2.42 |
| ODA — pesticide regulation | $5.43 | $19.23 | $67.28 | $85.80 |
| Food safety — produce rule | $13.33 | $5.45 | $21.93 | $147.33 |
| Labor health and safety requirements | $50.35 | $35.85 | $92.96 | $60.43 |
| Capital investment | $9.45 | $43.40 | $8.93 | $111.95 |
| H2A compliance | $79.88 | $109.23 | $206.04 | $177.54 |
| Full-time safety and compliance staff | $64.13 | $0.00 | $0.00 | $0.00 |
| Othera | $0.00 | $11.10 | $24.39 | $0.25 |
| Total | $251.02 | $275.97 | $532.72 | $696.75 |
aOther includes legal costs, ACA compliance and expenses associated with helping workers fill out hiring packets (for example, I-9s, etc.).
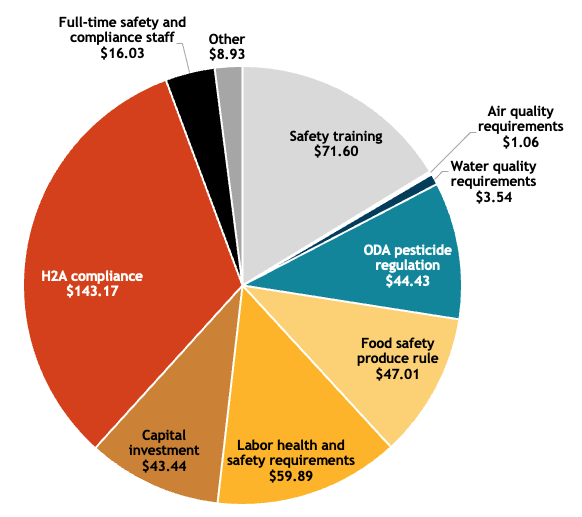
Figure 1 presents the costs for each category averaged across the four farms included in the analysis.
Since tree fruit production is an industry with a high need for hired labor, the compliance categories that relate to employee training and safety show the highest average costs. These include capital investment (which primarily involves employee housing), H2A visa compliance and labor safety trainings.
Environmental regulations related to water and air quality are less burdensome, though compliance with pesticide regulations can lead to significant costs.
Table 3 presents only the cash expenses associated with regulatory compliance and omits costs of owner/manager time that are not directly compensated.
When restricting the analysis to cash costs, the values are significantly lower for the two smaller farms, though roughly the same for the large farms. This is because smaller farms are less likely to have paid administrative staff to manage regulatory compliance issues. Rather, the owners of small farms might lead required employee trainings and fill out pesticide application records themselves while not taking an hourly wage.
|
Compliance category |
Large cherry |
Small cherry |
Large pear |
Small pear |
|---|---|---|---|---|
| Safety training | $27.12 | $50.02 | $68.59 | $94.08 |
| Air quality requirements | $0.43 | $0.09 | $0.06 | $0.00 |
| Water quality requirements | $0.74 | $1.20 | $3.58 | $2.42 |
| ODA — pesticide regulation | $5.43 | $15.23 | $67.28 | $64.29 |
| Food safety — produce rule | $13.33 | $4.45 | $11.21 | $39.80 |
| Labor health and safety requirements | $50.35 | $33.44 | $92.96 | $57.12 |
| Capital investment | $9.45 | $43.40 | $8.93 | $111.95 |
| H2A compliance | $78.23 | $57.14 | $202.50 | $144.04 |
| Full-time safety and compliance staff | $64.13 | $0.00 | $0.00 | $0.00 |
| Othera | $0.00 | $5.26 | $22.62 | $0.00 |
| Total | $249.21 | $210.23 | $477.72 | $513.71 |
aOther includes legal costs, ACA compliance and expenses associated with helping workers fill out hiring packets (for example, I-9s, etc.).
Conclusions
This analysis leads to five main conclusions.
1. Larger farms tend to have fewer employees per acre, which leads to lower employee overhead costs (for onboarding and training) per acre.
While producers do not normally think of “employees per acre” as a useful management metric, it can help explain the economies of scale that larger farms enjoy with respect to regulatory costs.
Each employee needs onboarding and safety training, which can be a significant expense. If a farm can maintain one worker for the full year instead of hiring temporary pruning staff and harvest season help, it could reduce total regulatory costs. This can be easier to achieve on large farms.
As you can see in Table 1, both the large cherry farm and the large pear farm have many fewer employees per acre than the smaller farms that grow the same crop.
2. Pear growers tend to rely more on workers with H2A visas than cherry growers do, leading to larger H2A compliance costs for pear producers.
Both pear and cherry producers rely on seasonal harvest crews, but cherry producers in Oregon usually have enough domestic workers that they do not need to hire H2A employees to pick fruit. Pear harvest comes later in the summer when many migratory workers have already returned home, leaving fewer domestic workers available and increasing reliance on H2A harvest crews.
The required expenses and administrative costs for H2A contracts are significant and can result in large overall regulatory costs for pear farms.
Note that we do not consider the impact of the Adverse Effective Wage Rate that serves as a minimum wage for H2A workers. In 2024, the Adverse Effective Wage Rate for Oregon was $19.25, which was significantly higher than the state minimum wage of $13.70 per hour and is often higher than the prevailing market wage.
3. Large farms often have compliance officers who handle many of the regulatory requirements facing tree fruit farms. This may be cheaper on a per-acre basis than small farms where owners manage regulatory compliance.
The large tree fruit operations that participated in this study have full-time staffs that help with regulatory compliance, along with other administrative duties. This may be more cost-effective on a per-acre basis than having a farmer-owner handle compliance on a smaller farm. Full-time compliance staff may be able to maintain compliance with fewer hours of work given their specialization and familiarity with the large set of complex regulations.
4. Recordkeeping requirements related to pesticide and food safety can create significant expense for farms, though this is an area in which more efficient record systems have the potential to reduce the burden.
Recordkeeping is an area of regulatory compliance that tends to have high variability in reported time expenditure. Farms vary in their recordkeeping processes, and some may have figured out ways to record information in a time-efficient way.
Moreover, some regulatory requirements tend to be vaguely written or are poorly understood, and some farms might spend more time than needed to maintain satisfactory records.
5. Requirements for capital investment, particularly related to farmworker housing, have the potential to be extremely burdensome. However, these costs are highly variable across farms and depend on the existing housing infrastructure on the farm.
In this article we do not attempt to estimate the cost of compliance with newly released Oregon OSHA farmworker housing regulations that will phase in from January 1, 2026, to January 1, 2028. These are likely to be very costly for some farms depending on the design of their existing housing facilities, even if currently in full compliance with existing law.
However, capital investments undertaken to comply with heat rules represented significant expense for some of these case farms. Costs depended on the existing facilities and economies of scale in installation and maintenance of air conditioning equipment.
Regulatory costs compared to farm income
As with other production costs, it can be useful to think about regulatory costs as a percentage of total farm revenue. This helps compare the cost of compliance over time and across industries.
According to the 2022 OSU Extension Enterprise Budget for sweet cherries, typical cherry revenue is $10,200 per acre. According to the 2021 Enterprise Budget for bartlett pears, typical pear revenue is approximately $11,250 per acre. At these per-acre revenue values, the total regulatory compliance costs presented above represent between 2.5% and 2.7% of revenue for cherries and between 4.7% and 6.6% of revenue for pears.
These values are higher than found by researchers for other industries but lower than found in recent research focused on specialty crop production in California.
How can growers make use of this information?
Regulatory costs faced by the agriculture industry have increased in recent years and are likely to continue to escalate. This means that it will be increasingly important that farmers actively manage their expenditures related to regulatory compliance, just like they do for labor, machinery and purchased inputs. Our findings with this study lead to a few suggestions for Oregon farmers:
- Think about how much time and money is being spent on regulatory costs on your farm. Are there ways to reduce the time spent? This might mean improving recordkeeping processes so that these required tasks take less time.
- Consider whether individual tasks or even crop enterprises can be adjusted to smooth labor requirements and reduce the number of employees that are onboarded each year. Each additional employee increases overhead costs related to training.
- Consider carefully whether using the H2A program is worth the cost. Make sure you are accounting for the full costs of using the program when doing your cost-benefit analysis of H2A contracts.
- Be wary of “overcompliance,” meaning spending time and money on compliance tasks that are not necessary and do not add value to the business. Regulations are complicated and often difficult to interpret. Talking to other growers about how they satisfy regulations and sharing strategies for efficiently complying with regulations could lead to cost savings on some operations. Participating in compliance trainings, through insurance providers or others, may be worthwhile.
For more information
Astill, G., T. Minor, S. Thornsbury and L. Calvin. 2019. U.S. Produce Growers’ Decision-making Under Evolving Food Safety Standards. No. 210, USDA Economic Research Service.
Bovay, J., P. Ferrier and C. Zhen. 2018. Estimated Costs for Fruit and Vegetable Producers to Comply with the Food Safety Modernization Act’s Produce Rule. USDA-ERS, Economic Information Bulletin Number 195.
Fennimore, S.A., and L. Tourte. 2019. Regulatory Burdens on Development of Automated Weeding Machines and Herbicides Are Different. Outlooks on Pest Management 30(4):147–151.
Hamilton, L., M.P. McCullough, G.W. Brester and J. Atwood. 2020. California’s Wage Rate Policies and Head Lettuce Prices. Journal of Food Distribution Research 51(2).
Hamilton, L., and M. McCullough. 2025. Two Decades of Change — Evolving Costs of Regulatory Compliance in the Produce Industry. Final report, January 2025.
McCullough, M., and L. Hamilton. 2021. “Assessing the Economic Impacts of Agricultural Equipment Emission Reduction Strategies on the Agricultural Economy in the San Joaquin Valley: Phase Two, 2018 Costs.” CARB Project NO. 17MSC004
OSHA, 2025. New employer-provided housing requirements with delayed effective dates: January 2026–January 2028.
Rutledge, Z., M. Castillo, T. Richards and P. Martin. 2024. H‐2A Adverse Effect Wage Rates and US Farm Wages. American Journal of Agricultural Economics.
Trebbi, F., and M.B. Zhang. 2022. The Cost of Regulatory Compliance in the United States. NBER Working Paper 30691.
About the authors


