Quality forages
Feeding quality forages can have a positive impact on the production level of livestock operations. In dairy cattle, high-quality forages are important for efficient milk production. Forages provide the effective fiber that is critical for good health and longevity. Inadequate fiber in the cow’s diet is one cause of acidosis and milk fat depression. Historically, as forage quality has changed, we have adjusted the forage-to-concentrate ratio to compensate for the reduction in energy and protein available to the cow. As cows continue to produce more milk, the ability to use lower quality forages has been drastically reduced, further emphasizing the need to include only the highest quality forages in our lactating cows’ diets.
Feeding proper forages can be just as important in the beef industry. Although the demand for quality isn’t as critical as in the dairy industry because nutrient requirements are generally lower for beef, feeding quality forages at the appropriate times can greatly improve productivity and minimize health and production challenges.
The need for high-quality forages in our cows’ diets has placed a premium value on these commodities in the marketplace. As with all markets, the economic law of supply and demand drives the prices paid for high-quality forages.
This publication helps you to calculate the cost of homegrown forages and the value of these forages against the cost of purchasing high-quality forages.
Forage production
Collecting the data necessary to make accurate decisions is critical when evaluating the costs and relative value of forages. Data on planting costs, maintenance costs, harvest costs and losses during storage, and feeding need to be determined in order to make any enterprise analysis. Table 1 s a worksheet designed to help you work through these costs. At times, estimates are the best numbers available. Use those until you can collect more accurate numbers.
|
Item |
Price |
Units |
$/acre |
Your Farm |
|---|---|---|---|---|
| Planting | ||||
| plowing | $50/hr | 1 hr | 50.00 | |
| rototill 2x | $85/hr | 1 hr | 85.00 | |
| discing 2x | $50/hr | 1 hr | 50.00 | |
| rolling & cultipacking | $50/hr | 1 hr | 50.00 | |
| Seeding | $50/hr | 1 hr | 50.00 | |
| fertilizer | $500/ton | 250 lb | 62.50 | |
| fert. application | $20/acre | 1 acre | 20.00 | |
| seed | $1.75/lb | 25 lb | 43.75 | |
| management | $20/acre | 1 acre | 20.00 | |
|
Establishment totals |
$431.25/acre | |||
|
Prorated costs per year (over 5 years) |
$86.25 | |||
|
Item |
Price |
Units |
$/acre |
Your Farm |
|---|---|---|---|---|
| Establishment cost (from Table 1) | 86.25 | |||
| Land ownership cost | $150/acre | 150.00 | ||
| Mower | $40/hr | 1/2 hr | 20.00 | |
| Chopper | $50/hr | 3/4 hr | 37.50 | |
| Truck | $30/hr | 3/4 hr | 22.50 | |
| Bagger | $30/hr | 3/4 hr | 22.50 | |
| Bag storage site preparation | $100/bag | 1 bag/12 acres | 8.70 | |
| Bag | $400/bag | 1 bag/12 acres | 33.30 | |
|
Total annual cost/acre |
$380.75 | |||
|
Total cost per ton bagged (15 tons silage at 33% dry matter) |
$25.38/ton |
Note: If you are using 1,500-pound round bales, an average cost would be $24/bale for 50% moisture bales, with an average of 13 bags/acre (10 tons). Total cost per ton round-baled would be $54.68. If you are putting up silage in a pit, an average cost to mow, chop, haul, and pack would be $15/ton for a load weighing approximately 6 tons. The cost per ton of silage in the pit would be approximately $17.62. These values can be substituted for bagger values in the example in Table 2.
Comparing your costs to alternative feeds
Only after you compare your forage enterprise production costs to alternatives can you make educated decisions on whether to grow or buy forage. Moisture content, crude protein, and fiber (neutral detergent fiber) content are important when evaluating homegrown forages to compare to other alternatives.
One easy comparison to make is the cost of your homegrown forages to dry hay available to purchase in your area. Table 3 (page 3) compares the dry matter content of various feeds and converts each to a relative dry matter value. For example, if you direct cut green chop at 25% dry matter, multiply the current price of hay by 0.277 to get the value of your green chop.
Example: Assume a stored hay price of $200 per ton and a 30% dry-matter silage, which has a relative value of 0.333.
- $200/ton hay × 0.333 = $66/ton value of silage
|
Feed |
% dry matter |
Relative value (stored hay = 1) |
|---|---|---|
|
Stored hay |
90 |
1 |
|
Freshly baled hay |
84 |
0.933 |
|
Wilted silage |
40 |
0.444 |
|
35 |
0.388 | |
|
30 |
0.333 | |
|
Direct-cut silage |
25 |
0.277 |
|
Green chop |
20 |
0.222 |
Determining moisture content
Collect a representative sample from the crop you wish to price on a dry-matter basis. This will allow you to compare feeds on an equal basis by taking the water portion out of the equation. Taking several samples helps overcome the variation in moisture within a truckload. Collect and transport samples in airtight plastic containers, such as closeable plastic bags.
Buyer and seller should agree on the sampling, testing, and pricing methods. The two parties should agree on paying the cost of testing, too. A number of commercial feed-testing laboratories will rush the results of a moisture test back to the sender if the sender requests it. Nutritional analyses done on the same samples can be sent later. Your Extension agent can provide a list of forage testing labs you can use.
Or, a quick moisture analysis can be done in your kitchen with a good scale and a microwave oven. For green chop, haylage, or silage, follow this procedure:
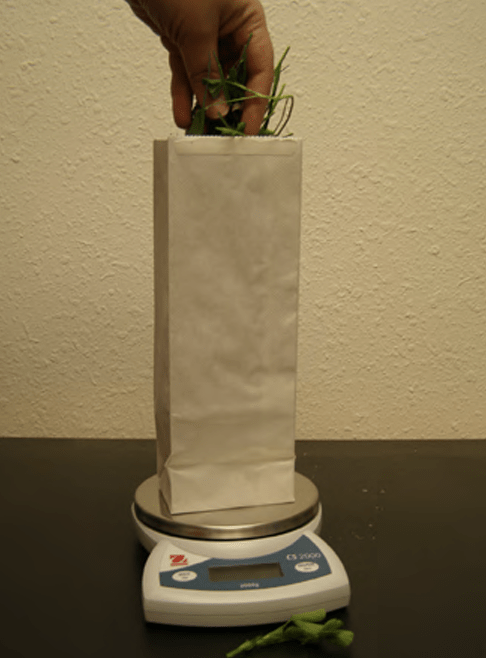
- Weigh a paper bag large enough to hold 4 ounces of your forage. Write down the weight as value “A.”
- Place about 4 ounces, or 100 grams, of your forage in the paper bag and weigh again. Write this down as value “B” (Figure 1).
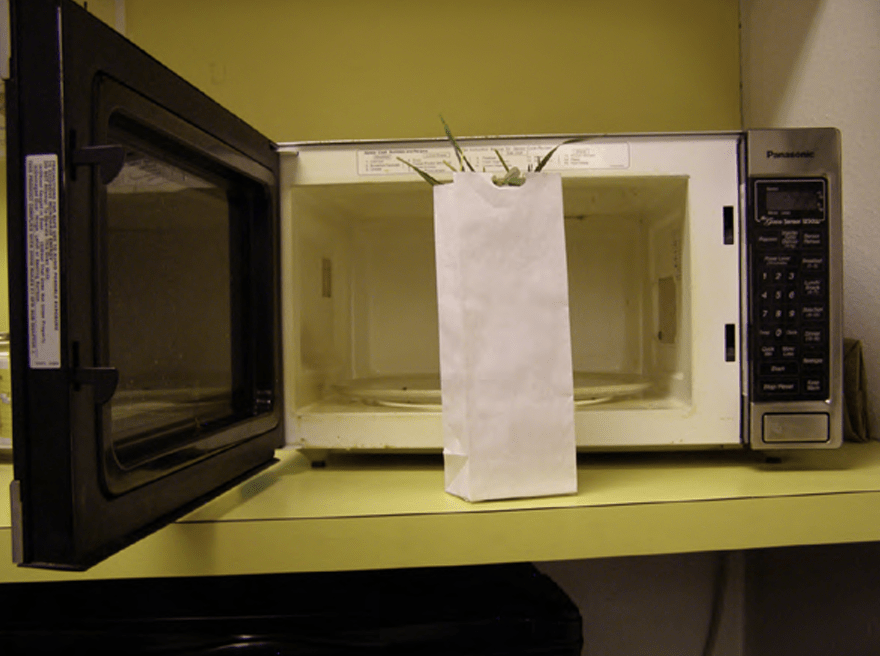
- Put a cup of water in a corner of the microwave oven, and begin drying the sample on the medium power setting. Dry for 3 minutes, remove the sample, and stir gently. Dry for another minute, stir, and dry for 1 minute.
- The sample should be getting dry and crisp. Weigh the sample and bag, stir again gently, and dry for 30 seconds. Continue the 30-second drying and weighing until the weight doesn’t change. If the sample begins to char, use the last weight. Record this final weight as “C” (Figure 2).
- Calculate the dry matter content using this formula:
- % dry matter (DM) content = (Total dry weight “C” minus bag weight “A” ÷ Total wet weight “B” minus bag weight “A”) × 100
- Example: The container bag weighs 25 grams, the wet forage is 100 grams (total wet weight of 125 grams), and the final dry weight turns out to be 45 grams total with bag.
- % DM = (45 grams (total dry weight "C") - 25 grams (bag weight "A") ÷ 125 grams (total wet weight "B") - 25 grams (bag weight "A")) × 100
- % DM = 20 grams (45 g - 25 g) divided by 100 grams (125 g - 25 g) × 100
- % DM = 0.2 × 100 = 20%
Experiment with drying times before running an "official" sample. Some microwave ovens don't heat uniformly. Dry the sample in different places in the oven. Some discoloration is normal, but blackened forage indicates you have burned off some of the dry matter.
A small dietetic or kitchen scale that weighs in grams will serve your weighing needs. They sell for $25 to $30. A little moist feed will improve animal intake, but don’t pay for moisture you don’t need. A few quick tests and calculations will keep forage producers and users happy with their farms’ production.
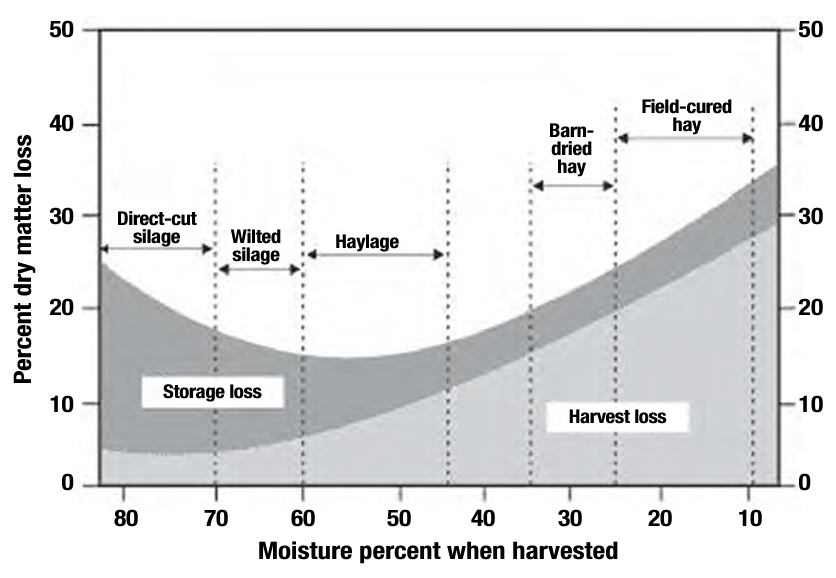
Storage losses
Consider storage losses when you price forages. Dry matter content at harvest directly affects dry matter losses that occur during storage. Figure 3 illustrates that hay dried in the field undergoes large dry matter losses before baling, whereas forages with higher moisture contents have higher losses while in storage.
Crude protein
You can more accurately determine the value of your forages by including crude protein as a quality measure and adjusting for storage losses you expect. Table 4 is designed to account for moisture, crude protein, and storage losses of silage.
|
Example |
Your Farm |
|
|---|---|---|
| 1. Market price of reference hay | $200.00 | |
| 2. Dry matter of reference hay | 90% | |
| 3. Crude protein of reference hay | 22% | |
| 4. Dry matter of forage you want to price | 33% | |
| 5. Crude protein of forage you want to price | 16% | |
| 6. Divide line 4 by line 2 | 0.4 | |
| 7. Divide line by 5 by line 3 | 0.73 | |
| 8. Multiply line 7 times line 6 | 0.29 | |
| 9. Multiple line 8 times line 1 | $58.00 | |
| 10. Estimated loss in storage | 20% | |
| 11. Subtract line 10 from 100% | 80% | |
| 12. Multiply line 9 times line 11 | $46.40 |
Line 12 represents the value of your forage compared to one available commercially in the marketplace. It is important to remember that we adjusted for only moisture and crude protein loss in our storage system.
