Contents
- Summary
- Why is saving energy important?
- Factors affecting irrigation energy use
- Improving the irrigation system
- Pumping system
- Common pumps used for irrigation
- Variable frequency drive
- Pump performance curves
- Common causes of poor pump performance
- Understanding demand and demand charges
- Irrigation system
- Key takeaways
- References and resources
- Acknowledgments
Summary
Energy use in irrigated agriculture falls into three major categories:
- Field operations: tillage, seeding/planting, fertilizer and chemical applications.
- Irrigation systems: water pumping, pressurization, pipelines, and water application and distribution.
- Processing: harvest operations, cleaning, transport and drying.
Among these categories, pumping for irrigation is often the largest and the most energy-intensive component.
Because every gallon of water pumped requires energy, improving irrigation efficiency directly translates into energy savings. Efficient irrigation reduces both power costs and water use, improving profitability and conserving limited water resources.
Three primary strategies can help you improve irrigation water and energy efficiency:
- Inspect and evaluate your irrigation pump.
- Upgrade or modernize your irrigation system and its components — this is an investment!
- Improve your irrigation water management practices.
Remember: Saving water also saves energy — and ultimately reduces costs.
Why is saving energy important?
Efficient irrigation equipment is essential to the viability of farms and ranches. A 2018 survey by the U.S. Department of Agriculture showed that about 50 million acres in the U.S. use pumped water for irrigation. Energy costs for these systems average $2.4 billion per year, or roughly $48 per irrigated acre. Farms also spend an additional $20 per acre on maintenance and repairs to keep irrigation systems operating efficiently.
A significant portion of this energy use is avoidable with proper system design and management. An estimated 25% of the electrical energy used for irrigation pumping is wasted due to poor pump and motor efficiency, incorrect system pressure, worn components or mismatched equipment. These inefficiencies increase operational costs and reduce system performance.
Because pumping is often the largest energy demand in irrigated agriculture, regularly evaluating and maintaining your irrigation system is critical to effective irrigation water management. Even small improvements in efficiency can translate into substantial water savings, lower energy bills and improved system reliability.
Factors that affect irrigation energy use
Irrigation energy use is influenced by how water is pumped, pressurized, conveyed and applied in the field. Several components of an irrigation system — along with management decisions — directly affect how much energy is required to deliver water to the crop. Some factors can be improved through simple management adjustments, while others may require equipment upgrades or system redesign.
Understanding these factors can help identify opportunities to reduce energy use, lower pumping costs and improve system performance.
Improving the irrigation system
Irrigation equipment that is not designed for peak efficiency or is poorly maintained will reduce the control of water being applied, resulting in uneven water distribution, excess or deficient irrigation, and water runoff. This can result in crop stress and reduced yields.
Irrigation system improvements are just one aspect of reducing energy costs. Other components include managing the timing and application of irrigation water, which helps reduce costs, save energy and save water.
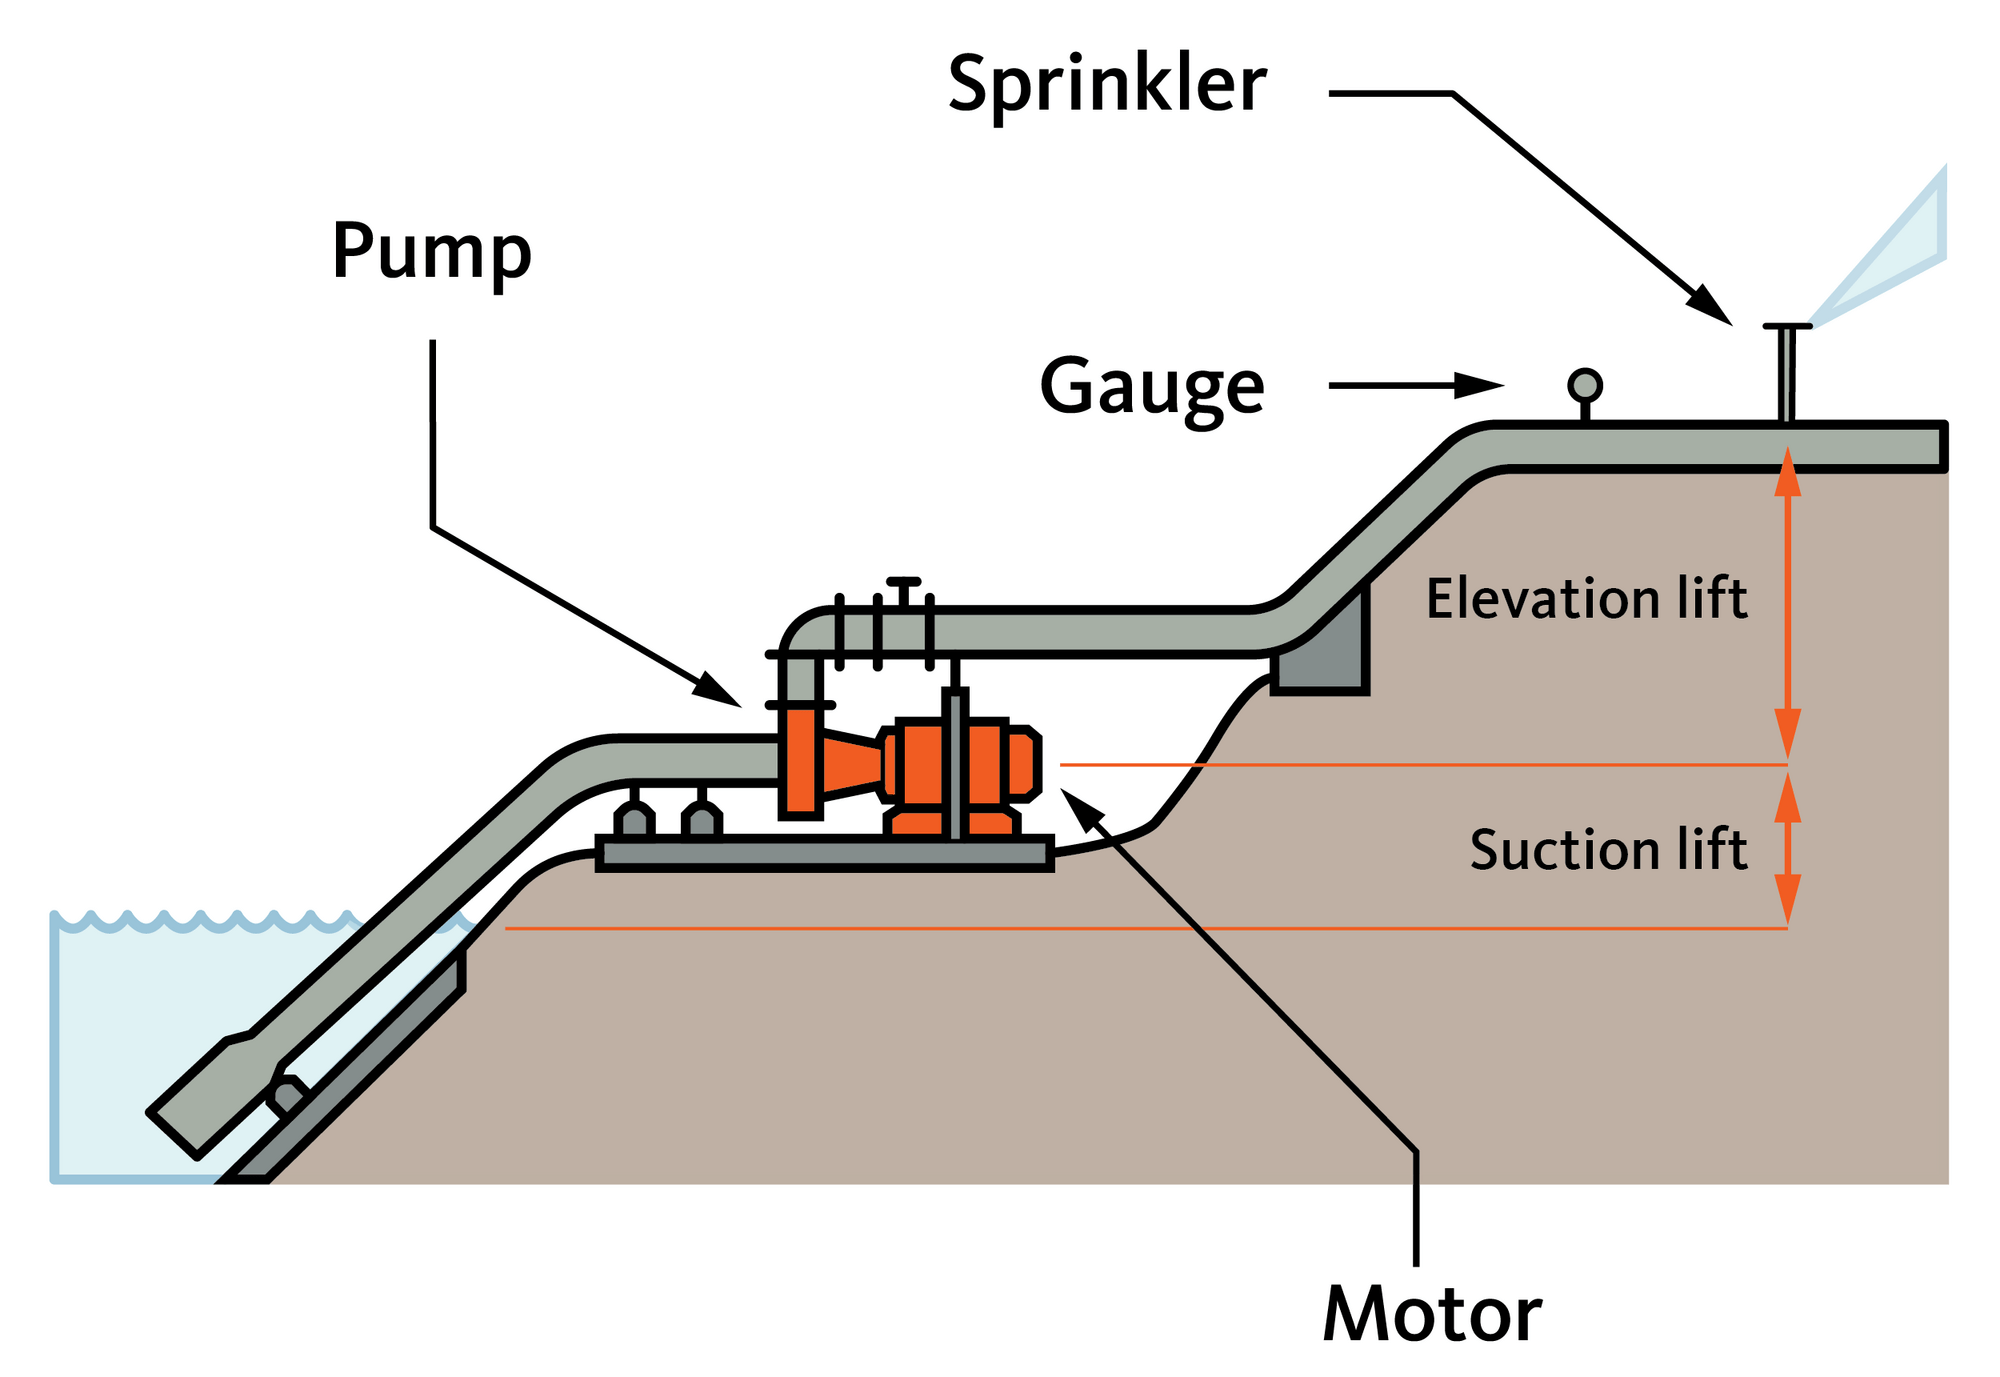
Pumping system
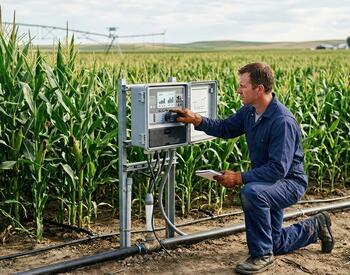
One of the most effective ways to reduce irrigation energy costs is to improve and maintain the pumping system. A pumping system comprises several interrelated components that work together to move water and determine overall system efficiency.
The main components of a pumping system include (Figure 1):
- Pump hydraulics: the impeller and the casing.
- Power transmission components: shaft, couplings and bearings.
- Motor or engine: provides mechanical energy.
Each of these components influences total pumping efficiency. Wear, misalignment, improper sizing or operating the pump outside its best efficiency point can significantly increase energy use.
Pumping system efficiency also varies with motor horsepower, meaning efficiency benchmarks and expectations differ by system size.
Submersible pumps are often slightly less efficient than surface-mounted motor pumps due to additional hydraulic and electrical losses; however, they may be necessary or advantageous in certain well configurations. To maintain optimal performance, qualified pump professionals should inspect and test irrigators' pumping systems every three to five years, or anytime major system changes occur. Major changes include nozzle changes, pressure modifications or irrigation system upgrades.
Major components of a centrifugal pump
- The casing encloses the pump hydraulics and directs water into and out of the impeller chamber.
- The impeller (green) is the rotating component that transfers energy to the water, increasing its velocity and pressure.
- The shaft connects the impeller to the motor and transmits rotational power.
- The shaft coupling ensures proper alignment and torque transfer between the pump and motor shafts.
- A mechanical seal prevents water leakage where the shaft passes through the casing while allowing rotation.
- Bearings support the rotating shaft and reduce friction within the motor housing.
- The electric motor converts electrical energy into mechanical energy: The rotor (copper-colored) rotates with the shaft inside the stationary stator (blue/teal), which generates the magnetic field that drives motion. The motor housing encloses and protects the motor components.
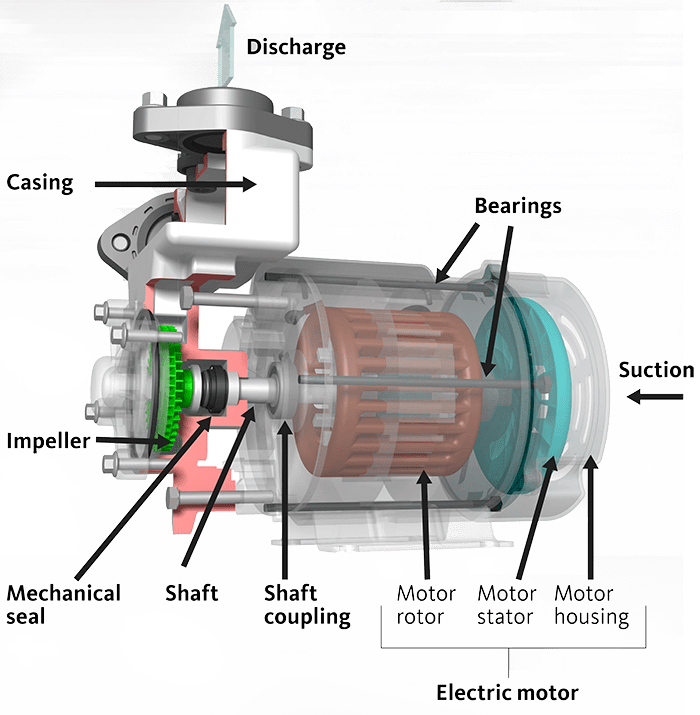
Together, these elements convert electrical energy into hydraulic energy to move irrigation water efficiently.
|
Motor horsepower (hp) |
Low (%) |
Fair (%) |
Good (%) |
Excellent (%) |
|---|---|---|---|---|
|
3–5 |
< 41.9 | 41.9–49.9 | 50–54.9 | 55 or above |
|
7.5–10 |
< 44.9 | 44.9–52.9 | 53–57.9 | 58 or above |
|
15–30 |
< 47.9 | 47.9–55.9 | 56–60.9 | 61 or above |
|
40–50 |
< 52.9 | 52.9–59.9 | 60–64.9 | 65 or above |
|
75 and up |
< 55.9 | 55.9–62.9 | 63–68.9 | 69 or above |
Note: Pump efficiency ratings vary by pump type, operating conditions and system design. Test regularly to assess pump performance and identify opportunities to reduce energy use and operating costs.
Source: Southern California Edison, Interpreting Pump Efficiency Test Results and Tracking Pump Performance
Common pumps used for irrigation
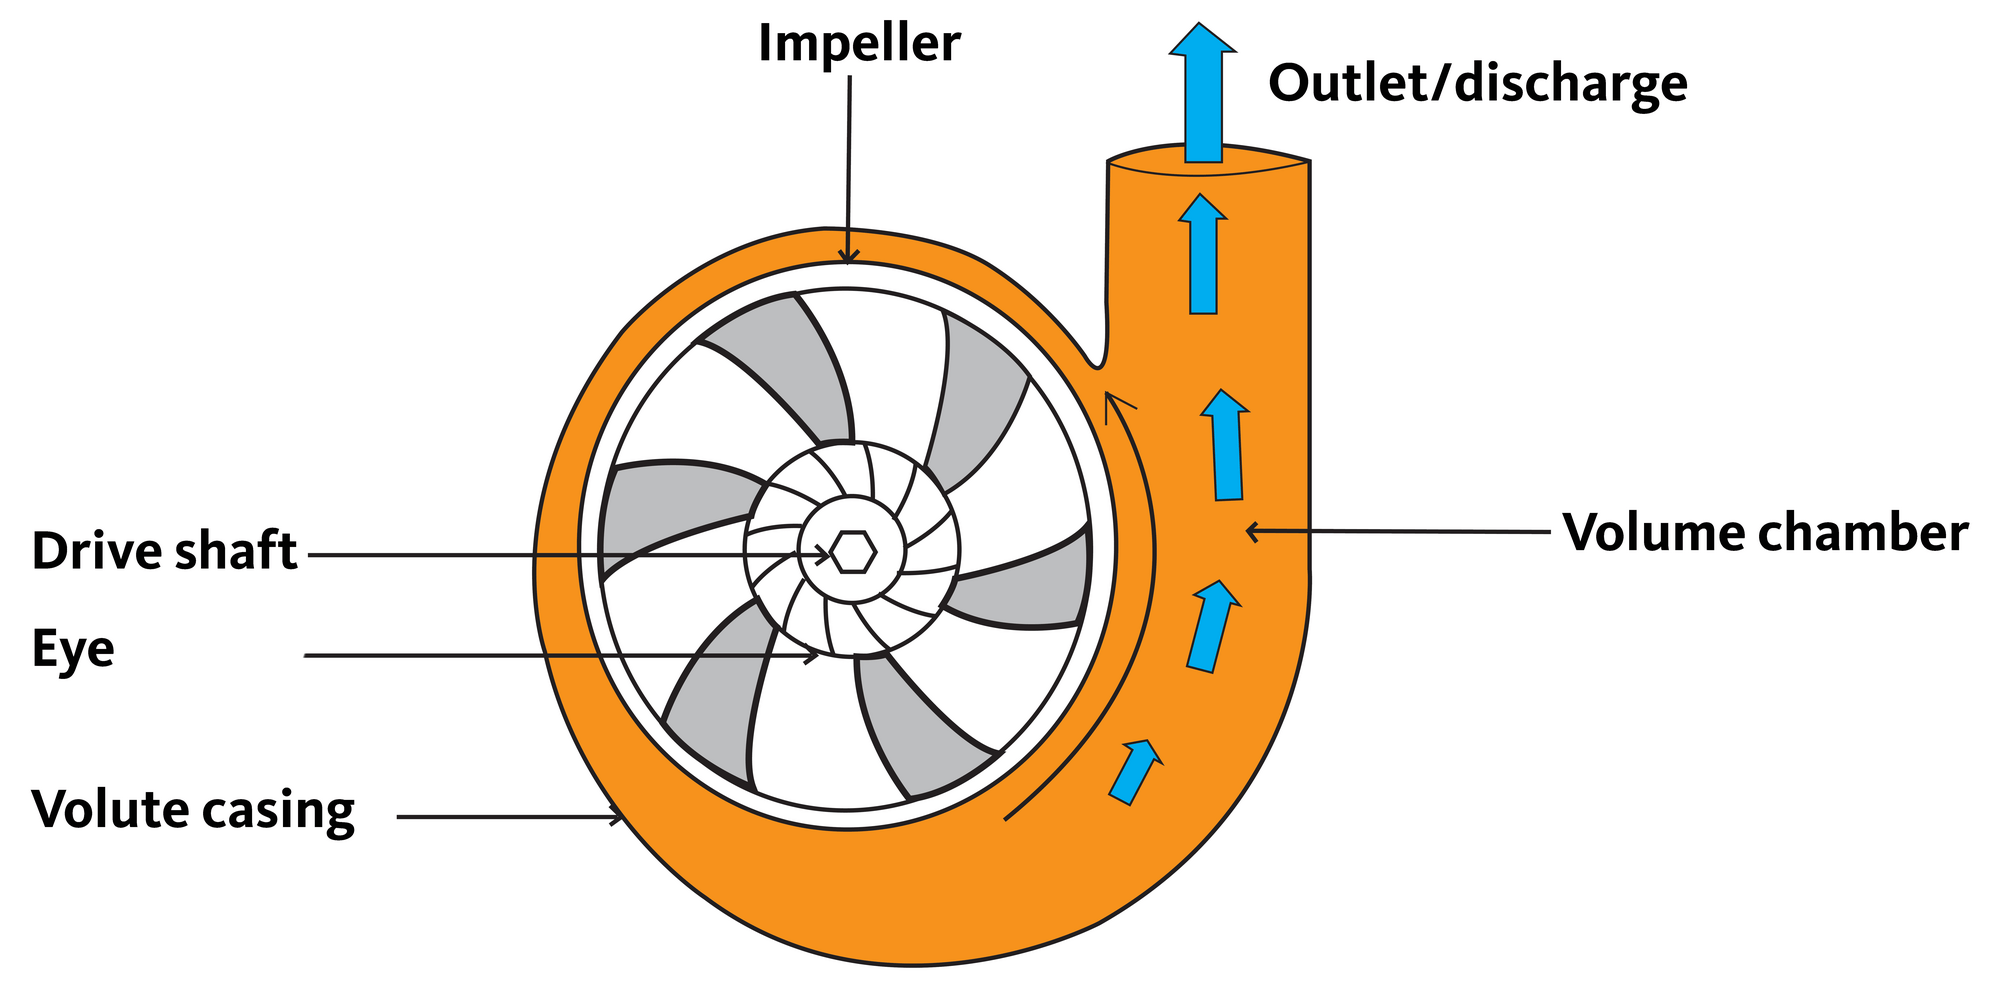
Horizontal and vertical centrifugal pumps
Horizontal and vertical centrifugal pumps are commonly used in irrigation to lift water from surface sources such as ponds, lakes, streams and rivers. These pumps use a rotating impeller to impart energy to the water, generating flow and pressure for irrigation.
Centrifugal pumps drawing from surface sources must be primed before operation. Priming fills the pump casing and suction line with water to remove air; if air remains, the pump cannot generate sufficient suction and will not operate properly.
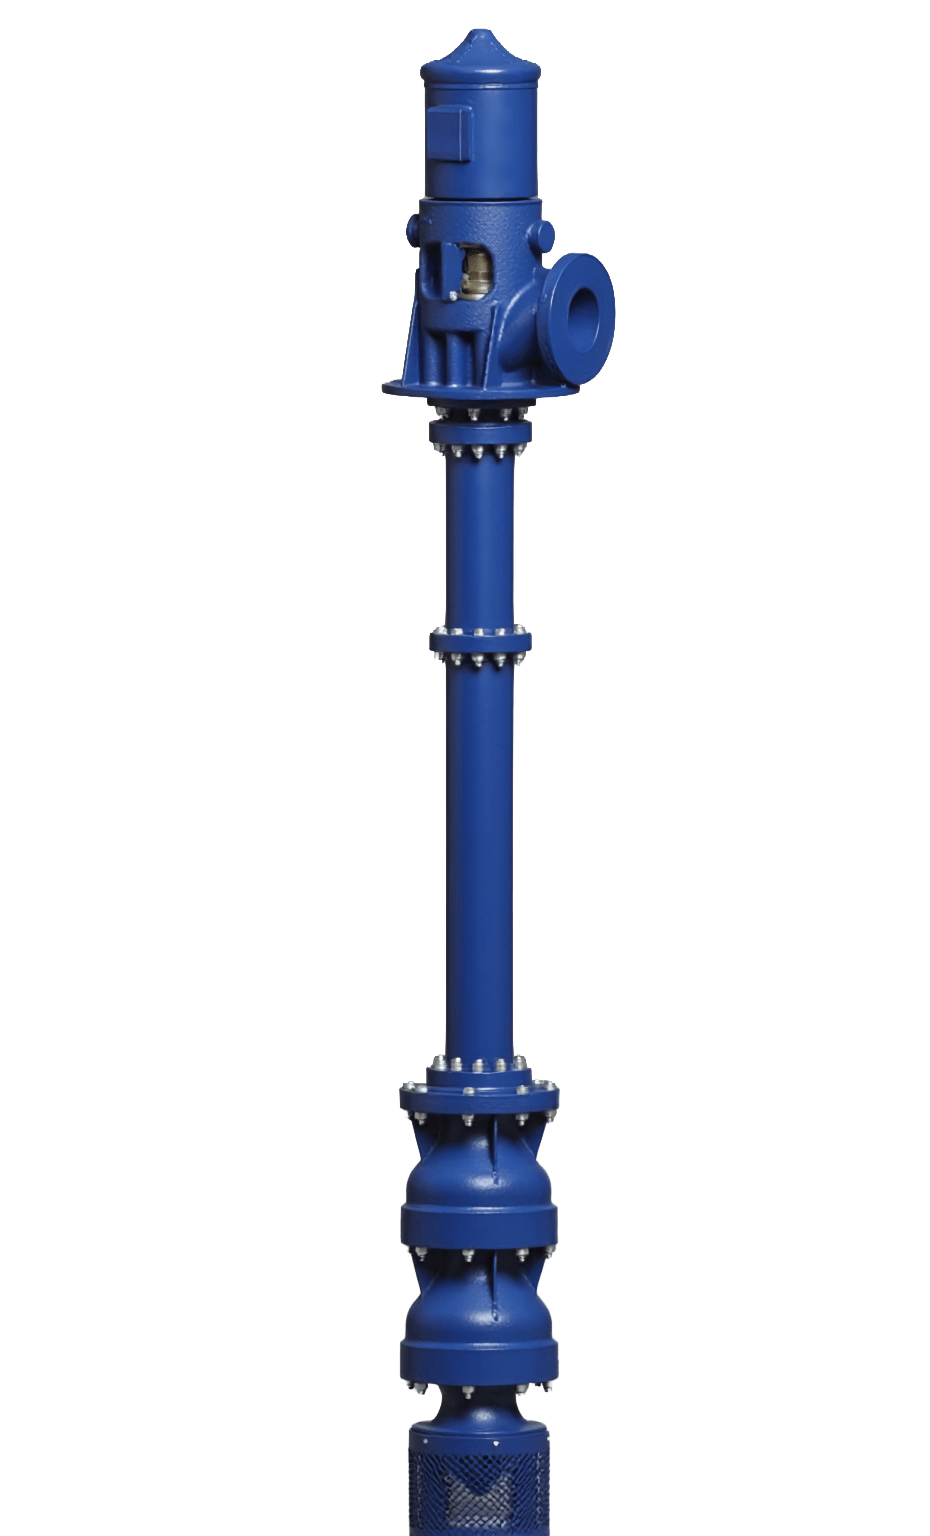
Deep-well line shaft turbine
Deep-well line-shaft turbine pumps are commonly used in cased wells or where water levels are too deep for surface centrifugal pumps. They lift water using a series of impellers (pump bowls) located below the water surface and connected to a surface-mounted motor by a vertical line shaft.
Because the pump intake and bowls are continuously submerged, turbine pumps do not require priming and can operate reliably at greater depths.
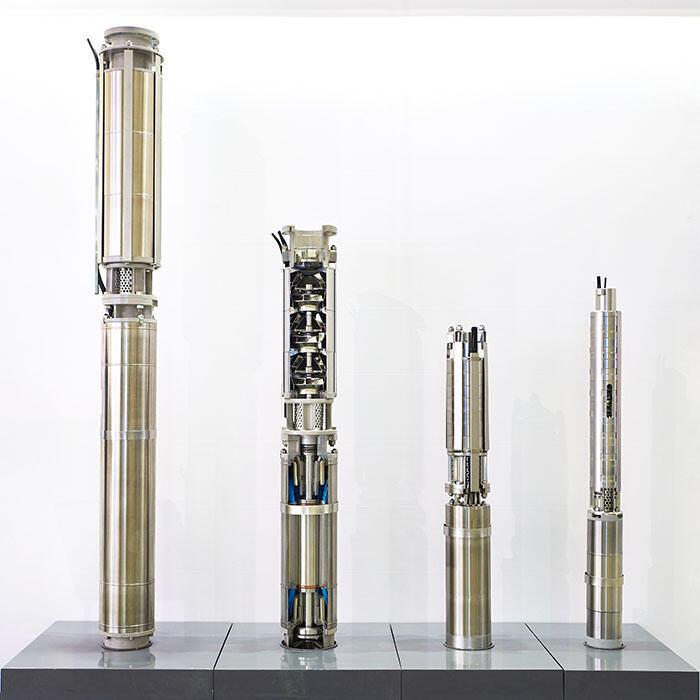
Submersible pump
A submersible pump is a type of turbine pump in which the electric motor is directly attached to the pump bowls and installed below the water surface. Both the pump and motor operate fully submerged, eliminating the need for a line shaft, surface drive head and intermediate bearings.
Submersible pumps use the same hydraulic principles as line-shaft turbine pumps but typically have lower mechanical losses, reduced maintenance and quieter operation. Proper electrical protection and water quality management are important to ensure motor longevity.
Motors
The motor on an irrigation system supplies power to lift and pressurize water to the irrigation delivery system. Common irrigation motors include:
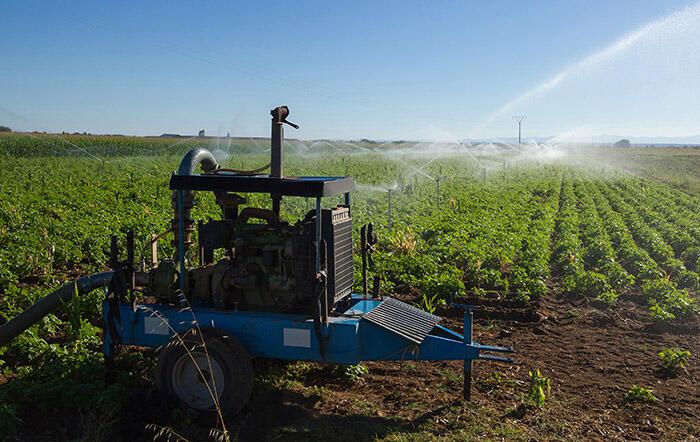
Internal combustion engines
- These motors run on diesel, gasoline, natural gas or propane.
- They are typically portable. These motors are often connected to horizontal centrifugal pumps by a shaft or belt.
Engine horsepower will match pump requirements to ensure pump longevity and limit fuel.
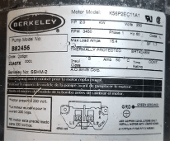
Electric motors
- Irrigation power systems use either single or three-phase power and operate on a single rated speed.
- The nameplate on the electric motor specifies the maximum power (in horsepower, Hp) output for the motor.
Motors on horizontal centrifugal pumps are often directly connected to the pump.
On deep well turbine pumps, a vertical hollow shaft connects the electric motor directly to the top of the pump shaft.
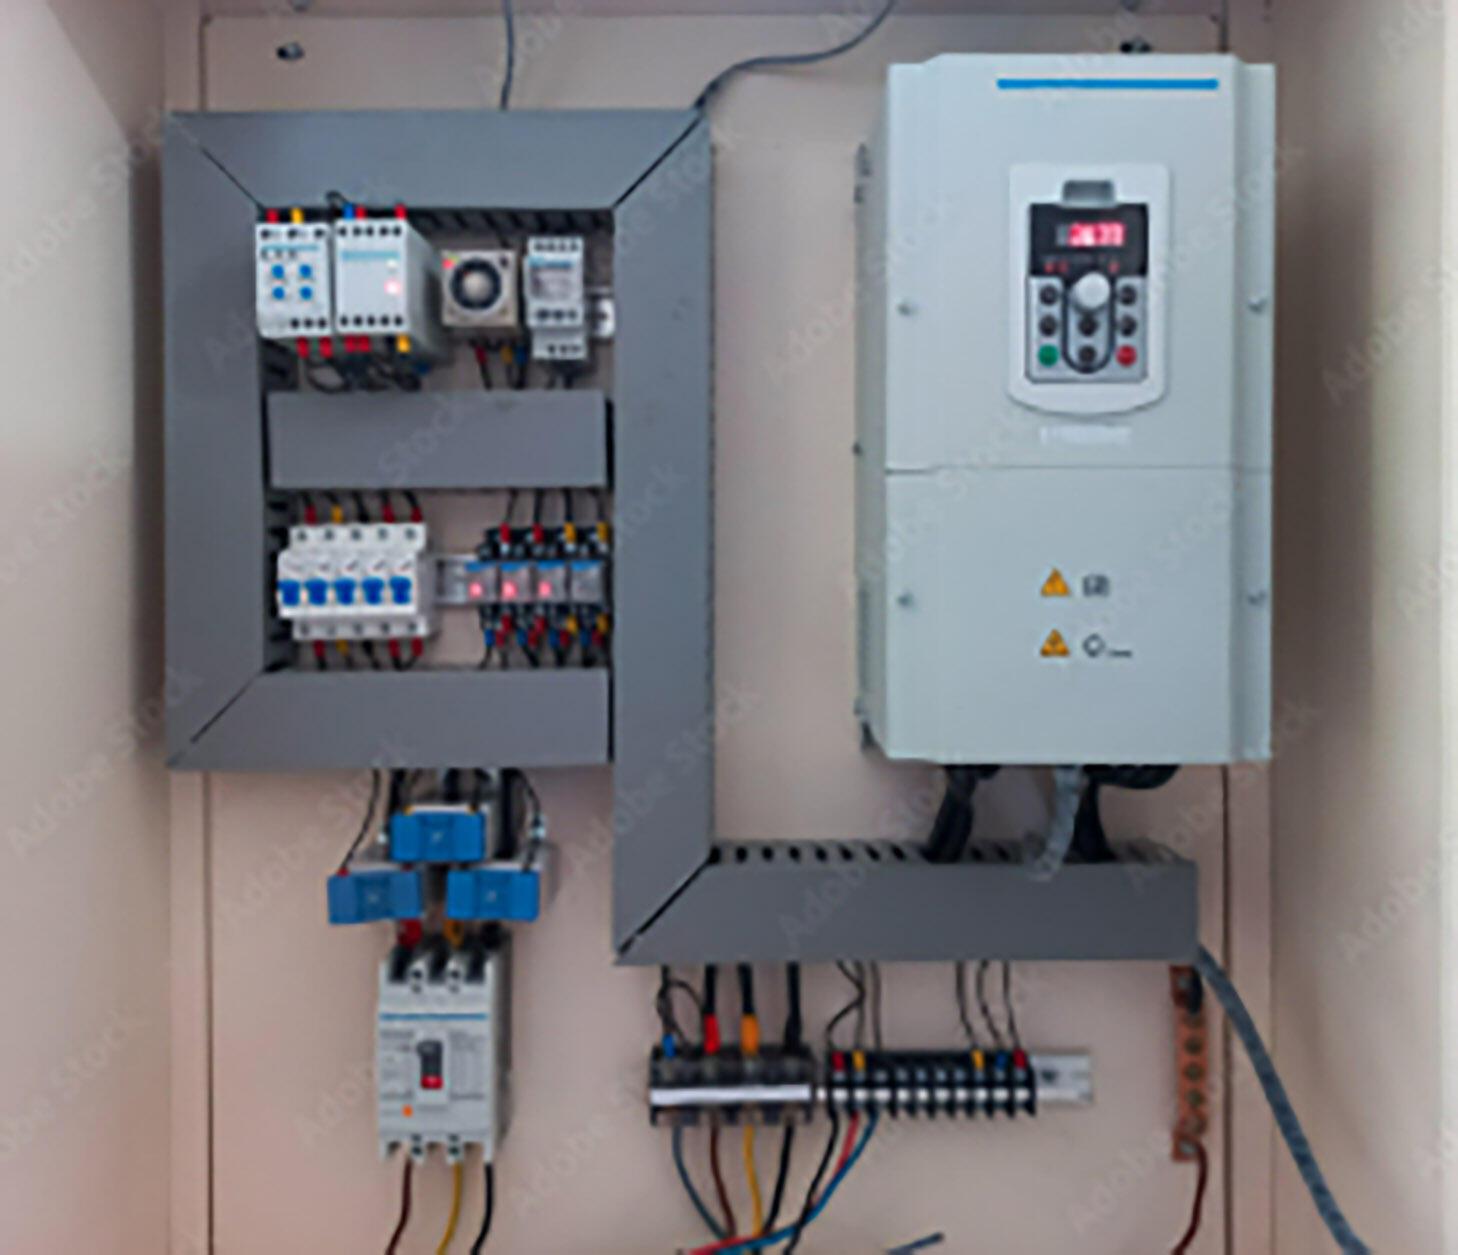
Variable frequency drive
Many irrigation systems have variable flow and pressure requirements. Variable frequency drives, or VFDs, function as electric controllers that vary the speed of the pump motor. This enables the pump to respond smoothly and efficiently to fluctuations in flow or pressure demands. These drives are also referred to as variable speed drives, or VSD.
In the right conditions, a VFD can effectively reduce energy costs, decrease electrical system stress and extend the life of the pump. VFDs work well in these situations:
- When there are multiple operating conditions (flow and/or pressure) being delivered by a single pump (such as within multiple sprinkler systems, zones or sets with varying or staggered start times).
- When there are multiple operating conditions across multiple pumps connected to the same main line.
- When the system needs a “soft start” (slow start to prevent power surge or water hammering).
- When a phase conversion from one-phase to three-phase is required.
- When an existing pumping system requires replacement due to age and condition, or due to changes in the irrigation system that require different flows or pressures.
- When it is less expensive to install a VFD than replacing or reconditioning your existing pump.
To determine if a VFD is right for you, consult your local irrigation pump dealer or your local power company. Electrical incentives for installing VFDs may be available through your local electric utility.
Pump performance curves
Pump curves (sometimes called pump performance curves or head capacity curves) are used to determine a pump’s ability to produce flow under varying operating conditions.
Use pump curves to evaluate the performance of your existing pump or to determine the right pump for a new or upgraded irrigation system.
In selecting the right pump or analyzing an existing pump, you will need to know how to read pump curves. Each manufacturer’s curve looks a little different, and each pump type has its own set of curves. Pump curves provided by the manufacturers typically include relations between:
- Total dynamic head (ft) versus flow (gpm).
- Efficiency (%) versus flow (gpm).
- Input horsepower (bhp) versus flow (gpm).
There are several types of pumps for irrigation applications. Consult your local pump supplier or irrigation professional to determine the correct pump curve for your system.
How to read a pump curve
The pump curve shown in Figure 11 represents a Cornell centrifugal irrigation pump operating at 1775 RPM. The vertical axis on the left side of the graph represents total dynamic head measured in feet. TDH represents the total resistance the pump must overcome to deliver water through the irrigation system.
TDH is calculated as the sum of:
- Elevation head.
- Friction loss in the pipeline system.
- Pressure head required at the irrigation device (sprinklers, drip system, etc.).
The horizontal axis at the bottom of the graph represents the pump flow capacity in gallons per minute (GPM).
The black curves represent the pump's performance at different impeller diameters (8-inch to 12.75-inch).
The blue curved lines represent pump efficiency contours (%).
The green dashed diagonal lines represent the brake horsepower required to operate the pump under different flow and head conditions.
Pump efficiency directly affects energy costs. Pumps operate most efficiently near the center of the efficiency curves and become less efficient when operating far from this region.
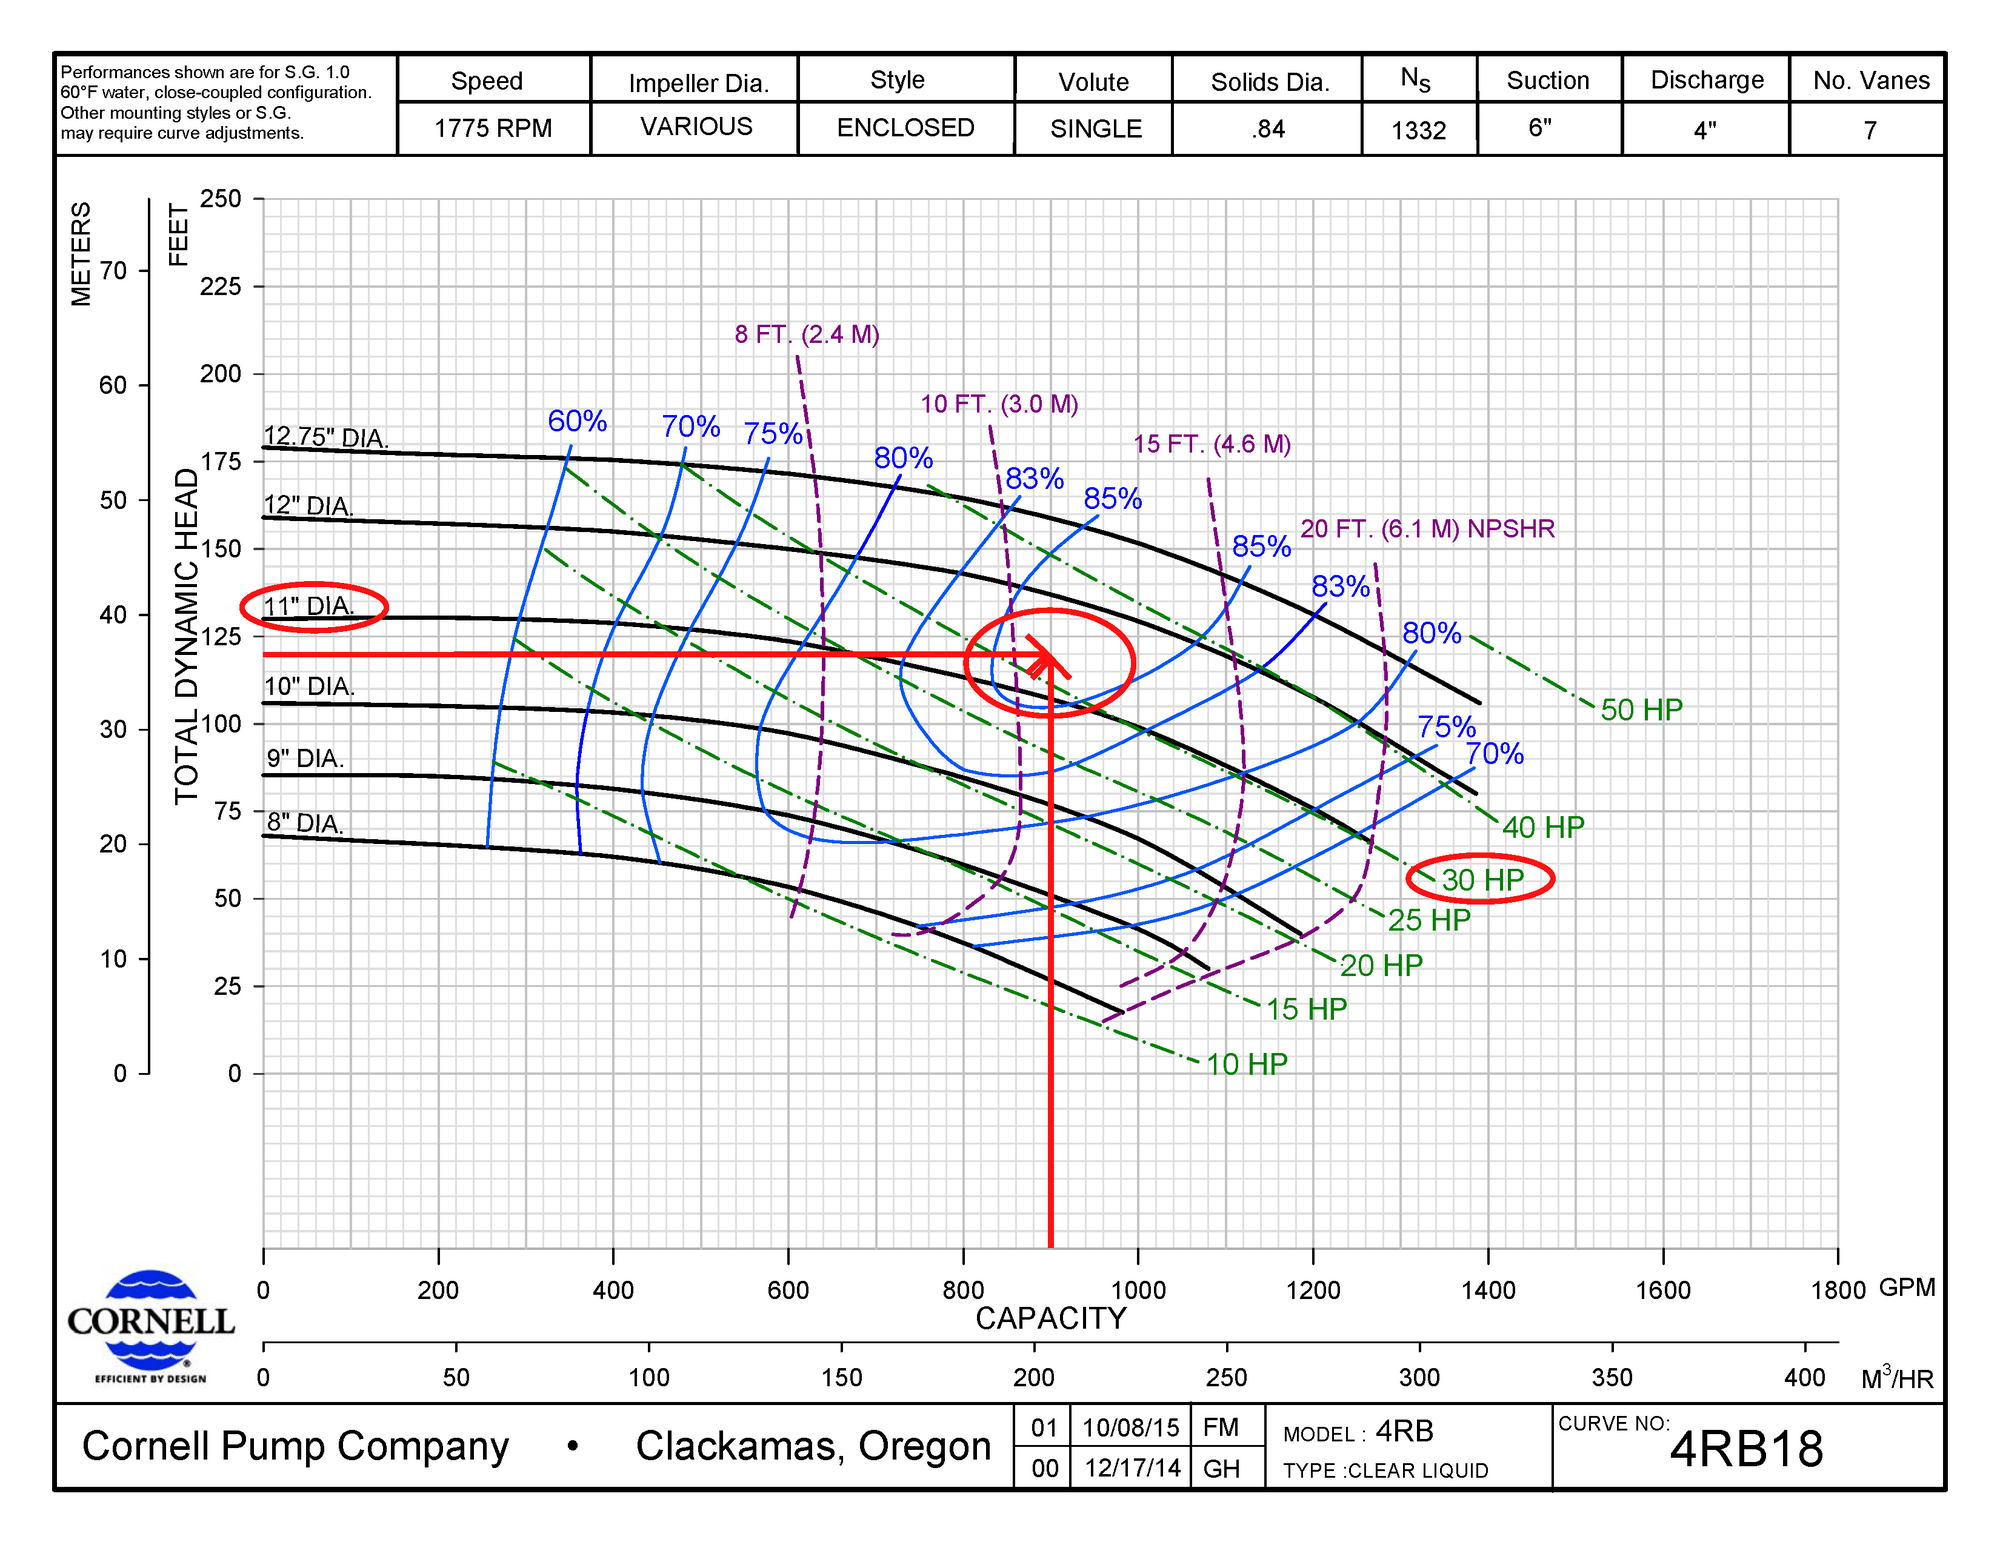
The point where the two lines intersect identifies the operating point of the pump.
At this point the intersection falls near the 25 horsepower line.
To ensure the pump can reliably meet system demands, select the next-largest horsepower (30 hp).
Common causes of poor pump performance
- Impeller is out of adjustment due to wear.
- Pumping rate (GPM) is higher than the well can supply, due to overestimating well yield or depletion of water table.
- Impeller is damaged due to improper filtering or adjustment.
- Incorrect power unit selection, which can overload or underload electric motors or engines.
- Lack of annual maintenance.
- Changes in operating condition. For example, a drop in water table or converting from a high- to a low-pressure sprinkler system.
- Incorrect installation of the pump.
- Incorrect pump design for actual operating conditions.
These common causes of poor pump performance increase your overall power costs, result in costly repairs and affect your crop yields.
Understanding demand and demand charges
Demand is the amount of electrical power being used at a specific moment in time. Demand varies from hour to hour, day to day, and season to season, depending on equipment operation. Demand is measured in kilowatts (kW), not kilowatt-hours (kWh).
A demand charge is one way utilities recover the costs associated with maintaining the electrical generation and distribution capacity needed to meet periods of high power use.
Depending on the utility, demand charges may be calculated using one of two common methods.
Method 1: Connected load or horsepower
Some utilities calculate demand charges based on the connected motor horsepower of the irrigation system. In this case, a fixed charge is applied per horsepower during each billing cycle.
Method 2: Peak kilowatt demand
Other utilities calculate demand charges based on the highest power usage recorded during the billing period.
Electric meters measure power use in 15-minute intervals. The utility calculates the average power used during each interval and identifies the highest average interval during the month. This value becomes the demand charge for that billing period.
Irrigation system
Pipelines are the primary component of an irrigation water delivery system. The pipeline must include properly sized pipes, fittings, valves and control devices to deliver water efficiently throughout the irrigation system. Improperly sized pipelines, poorly designed fittings or leaking components can increase friction losses and reduce water distribution uniformity. These issues often require the pump to operate at higher pressures, which increases energy consumption.
Regular inspection of pipelines, valves, pressure regulators and sprinkler components helps maintain efficient operation. If system inefficiencies are suspected, consult your irrigation dealer or pump specialist to evaluate your system and identify opportunities to reduce both water application and energy costs.
Other ways to reduce energy use include:
- Installing newer sprinkler technologies such as low-elevation spray application (LESA) or low-energy precision application (LEPA) systems on pivots.
- Replacing worn sprinkler nozzles with high-efficiency nozzles, such as rotators or spinners, that improve droplet distribution and reduce wind drift.
- Using dual-spray heads or spray plates to improve water distribution patterns.
- Converting to mobile drip irrigation (MDI) systems to apply water directly to the soil surface and reduce evaporation losses.
Irrigation water management
Irrigation water management is one of the most cost-effective ways to reduce energy consumption in irrigation systems. It involves applying the right amount of water at the right time to meet crop water requirements.
Efficient irrigation scheduling requires an understanding of soil-water relationships, crop water use and the water-holding capacity of the soil. Tools such as soil moisture sensors, evapotranspiration data and crop growth stage information can help producers determine when irrigation is needed and how much water should be applied.
Underapplying irrigation water can reduce crop yield and quality, while overapplying irrigation water wastes energy, increases pumping costs and may lead to nutrient leaching, runoff and reduced soil health. Proper irrigation scheduling helps optimize water use, reduce energy consumption and maintain crop productivity.
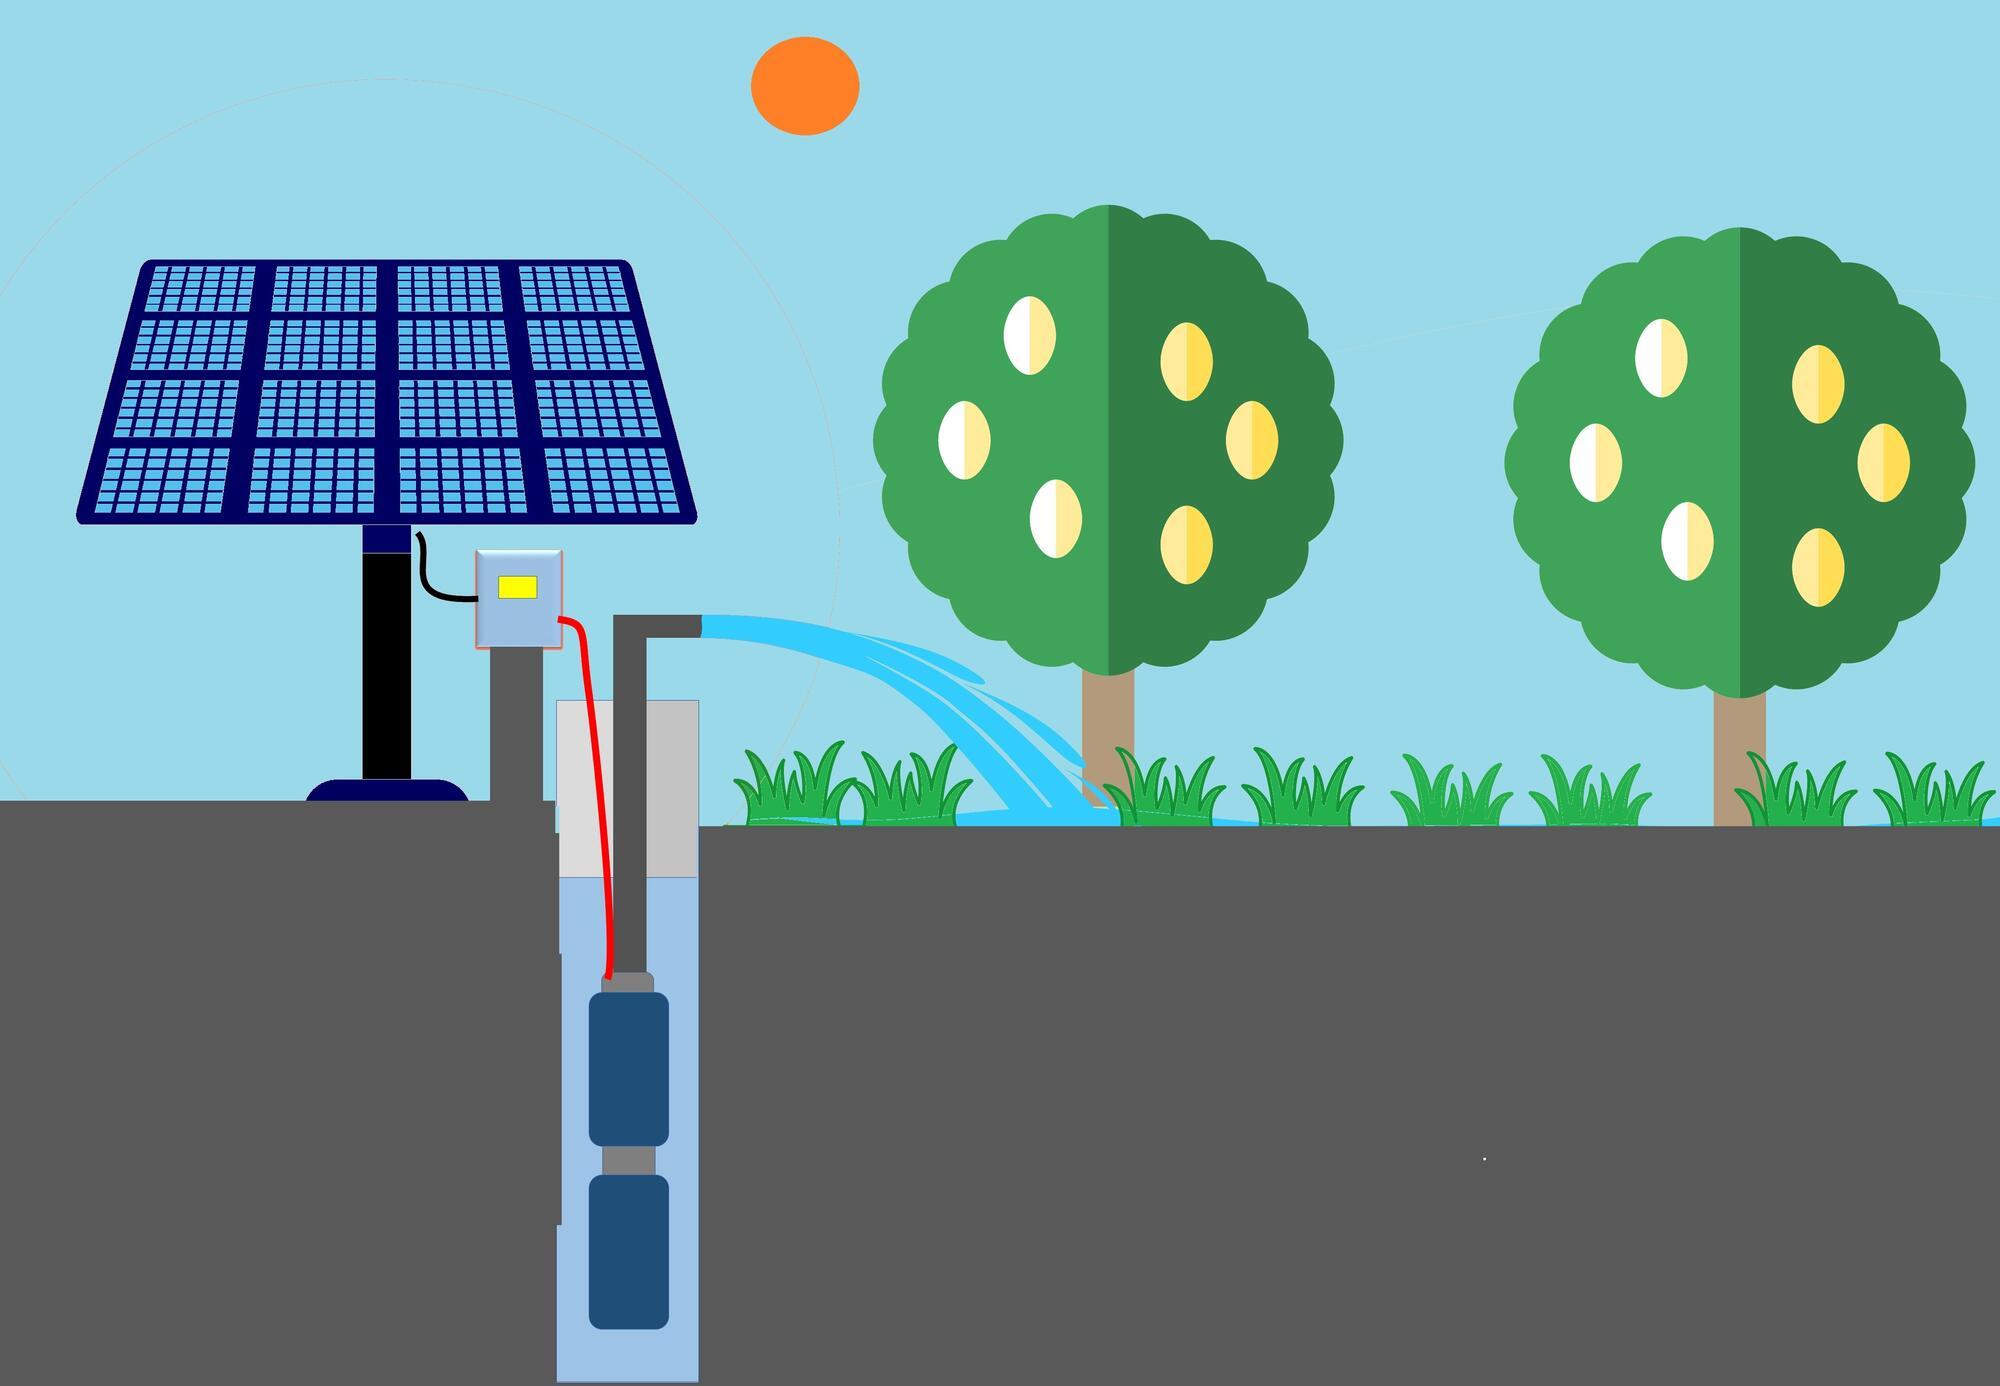
Renewable energy
In addition to improving efficiency, renewable energy options can help offset irrigation energy use. Solar and wind are the most common sources in agriculture, but others — such as hydropower, biopower and geothermal energy — may also be viable, depending on local conditions.
For example, piping irrigation district canals can allow users to take advantage of pressurized water, reducing pumping energy costs. These systems can also generate clean, reliable hydropower for the local electrical grid.
Another example is the use of agrivoltaics, which allow for producers to continue growing crops while generating energy from solar panels. To find out more about renewable energy options and incentives, contact your local utility, Natural Resource Conservation Service or USDA Rural Development.
Energy costs are a major component of irrigation system operation. Improving irrigation system efficiency can significantly reduce both water use and energy consumption while maintaining or improving crop productivity. Proper pump selection, system maintenance, efficient irrigation technologies and sound irrigation water management practices all play important roles in reducing energy demand.
By understanding how irrigation systems operate and adopting modern irrigation technologies and scheduling tools, producers can improve water distribution, lower operating costs and enhance the long-term sustainability of their agricultural operations.
Working with irrigation professionals, Extension specialists and local utilities can help producers identify opportunities to improve irrigation efficiency and implement energy-saving practices tailored to their specific production systems.
References and resources
Central Electric Cooperative Inc., Understanding Demand & Demand Charges, 2021.
Energy Trust of Oregon, Energizing Oregon Renewable Distributed Energy Resource, A Partnership for Rural Resiliency, 2021.
Schaible, Glen, and M. Aillery. 2013, Western Irrigated Agriculture: Production Value, Water Use, Costs, and Technology Vary by Farm Size, U.S. Department of Agriculture, Economic Research Service.
Chavez, J.L., D. Reich, J.C. Loftis and D.L. Miles. 2011, Irrigation Pumping Plant Efficiency, 4.712, Colorado State University Extension.
Harrison, K., R.E. Skinner. 2012, Irrigation Pumping Plants and Energy Use, 837, University of Georgia Extension.
Morris, M., and V. Lynne. 2006, Energy Saving Tips for Irrigators, IP278, ATTRA National Sustainable Agricultural Information Service, National Center for Appropriate Technologies
Yost, M., T. Young, N. Allen, D. Larson and J. Holt. 2020, Variable Frequency Drives for Irrigation Pumps, AG/Irrigation/2020-01pr, Utah State University Extension.
Frazier, R.S., and C. Jones. 2017, Irrigation Pump System Testing, BAE-1525, Oklahoma State University Extension.
USDA, Natural Resources Conservation Service, National Engineering Handbook, Irrigation Guide, Part 652, September 1997.
University of Nebraska and Michigan State University. 2012. Irrigation Energy Audit Manual
U.S. Department of Agriculture, National Agricultural Statistics Service. 2017 Census of Agriculture, 2018 Irrigation and Water Management Survey, Volume 3, Special Studies, Part 1. AC-17-SS-1. November 2019. Page 43, table 13.
U.S. Department of Agriculture, National Agricultural Statistics. Farm and Ranch Irrigation Survey. 2003, Volume 3 Special Studies, Part 1, 2002 Census of Agriculture. Washington, DC, November 2004.
Acknowledgments
This material is based upon work that is supported by the National Institute of Food and Agriculture, U.S. Department of Agriculture, under award No. 2021-38640-34695 through the Western Sustainable Agriculture Research and Education program under project number WPDP22-020. USDA is an equal opportunity employer and service provider. Any opinions, findings, conclusions, or recommendations expressed in this publication are those of the authors and do not necessarily reflect the view of the U.S. Department of Agriculture.
Contributors included Robert Wallace and Brad Moore, both of Wy'East Resource Conservation & Development, and Thomas Elzinga, Central Electric Cooperative. Reviewers included Matthew Alongi, Natural Resources Conservation Service State Irrigation Engineer; Mylen Bohle, Associate Professor, Emeritus; Troy Peters, Professor and Extension Irrigation Engineer, Irrigated Agriculture Research and Extension Center, Washington State University; Rex Barber of Big Falls Ranch, Terrebonne, Oregon; Mike Macy of Macy Farms, Culver, Oregon; Patrice Spyrka of Tumalo Alpen Ranch, Tumalo, Oregon; Greg Mohnen of Triple S Ranch; and Darrell Abby of Rock Island Ranch.
About the authors

Related publications