
Contents
- Summary
- What is soil moisture?
- Why measure soil moisture?
- Soil moisture content and soil moisture tension
- Measuring soil moisture
- Advantages and disadvantages of soil monitoring methods
- Considerations when using soil moisture monitors
- Remote sensing and other soil moisture monitoring techniques
- Soil moisture monitoring worksheet
Summary
Soil moisture monitoring is an key component of irrigation scheduling and water management. It involves measuring the amount of water stored within the crop root zone to support timely and efficient irrigation decisions. Methods range from basic field observations using the feel and appearance method to advanced sensor-based technologies and remote sensing tools. Integrating soil moisture monitoring with effective irrigation scheduling improves water-use efficiency and helps maintain optimal crop growth conditions.
What is soil moisture?
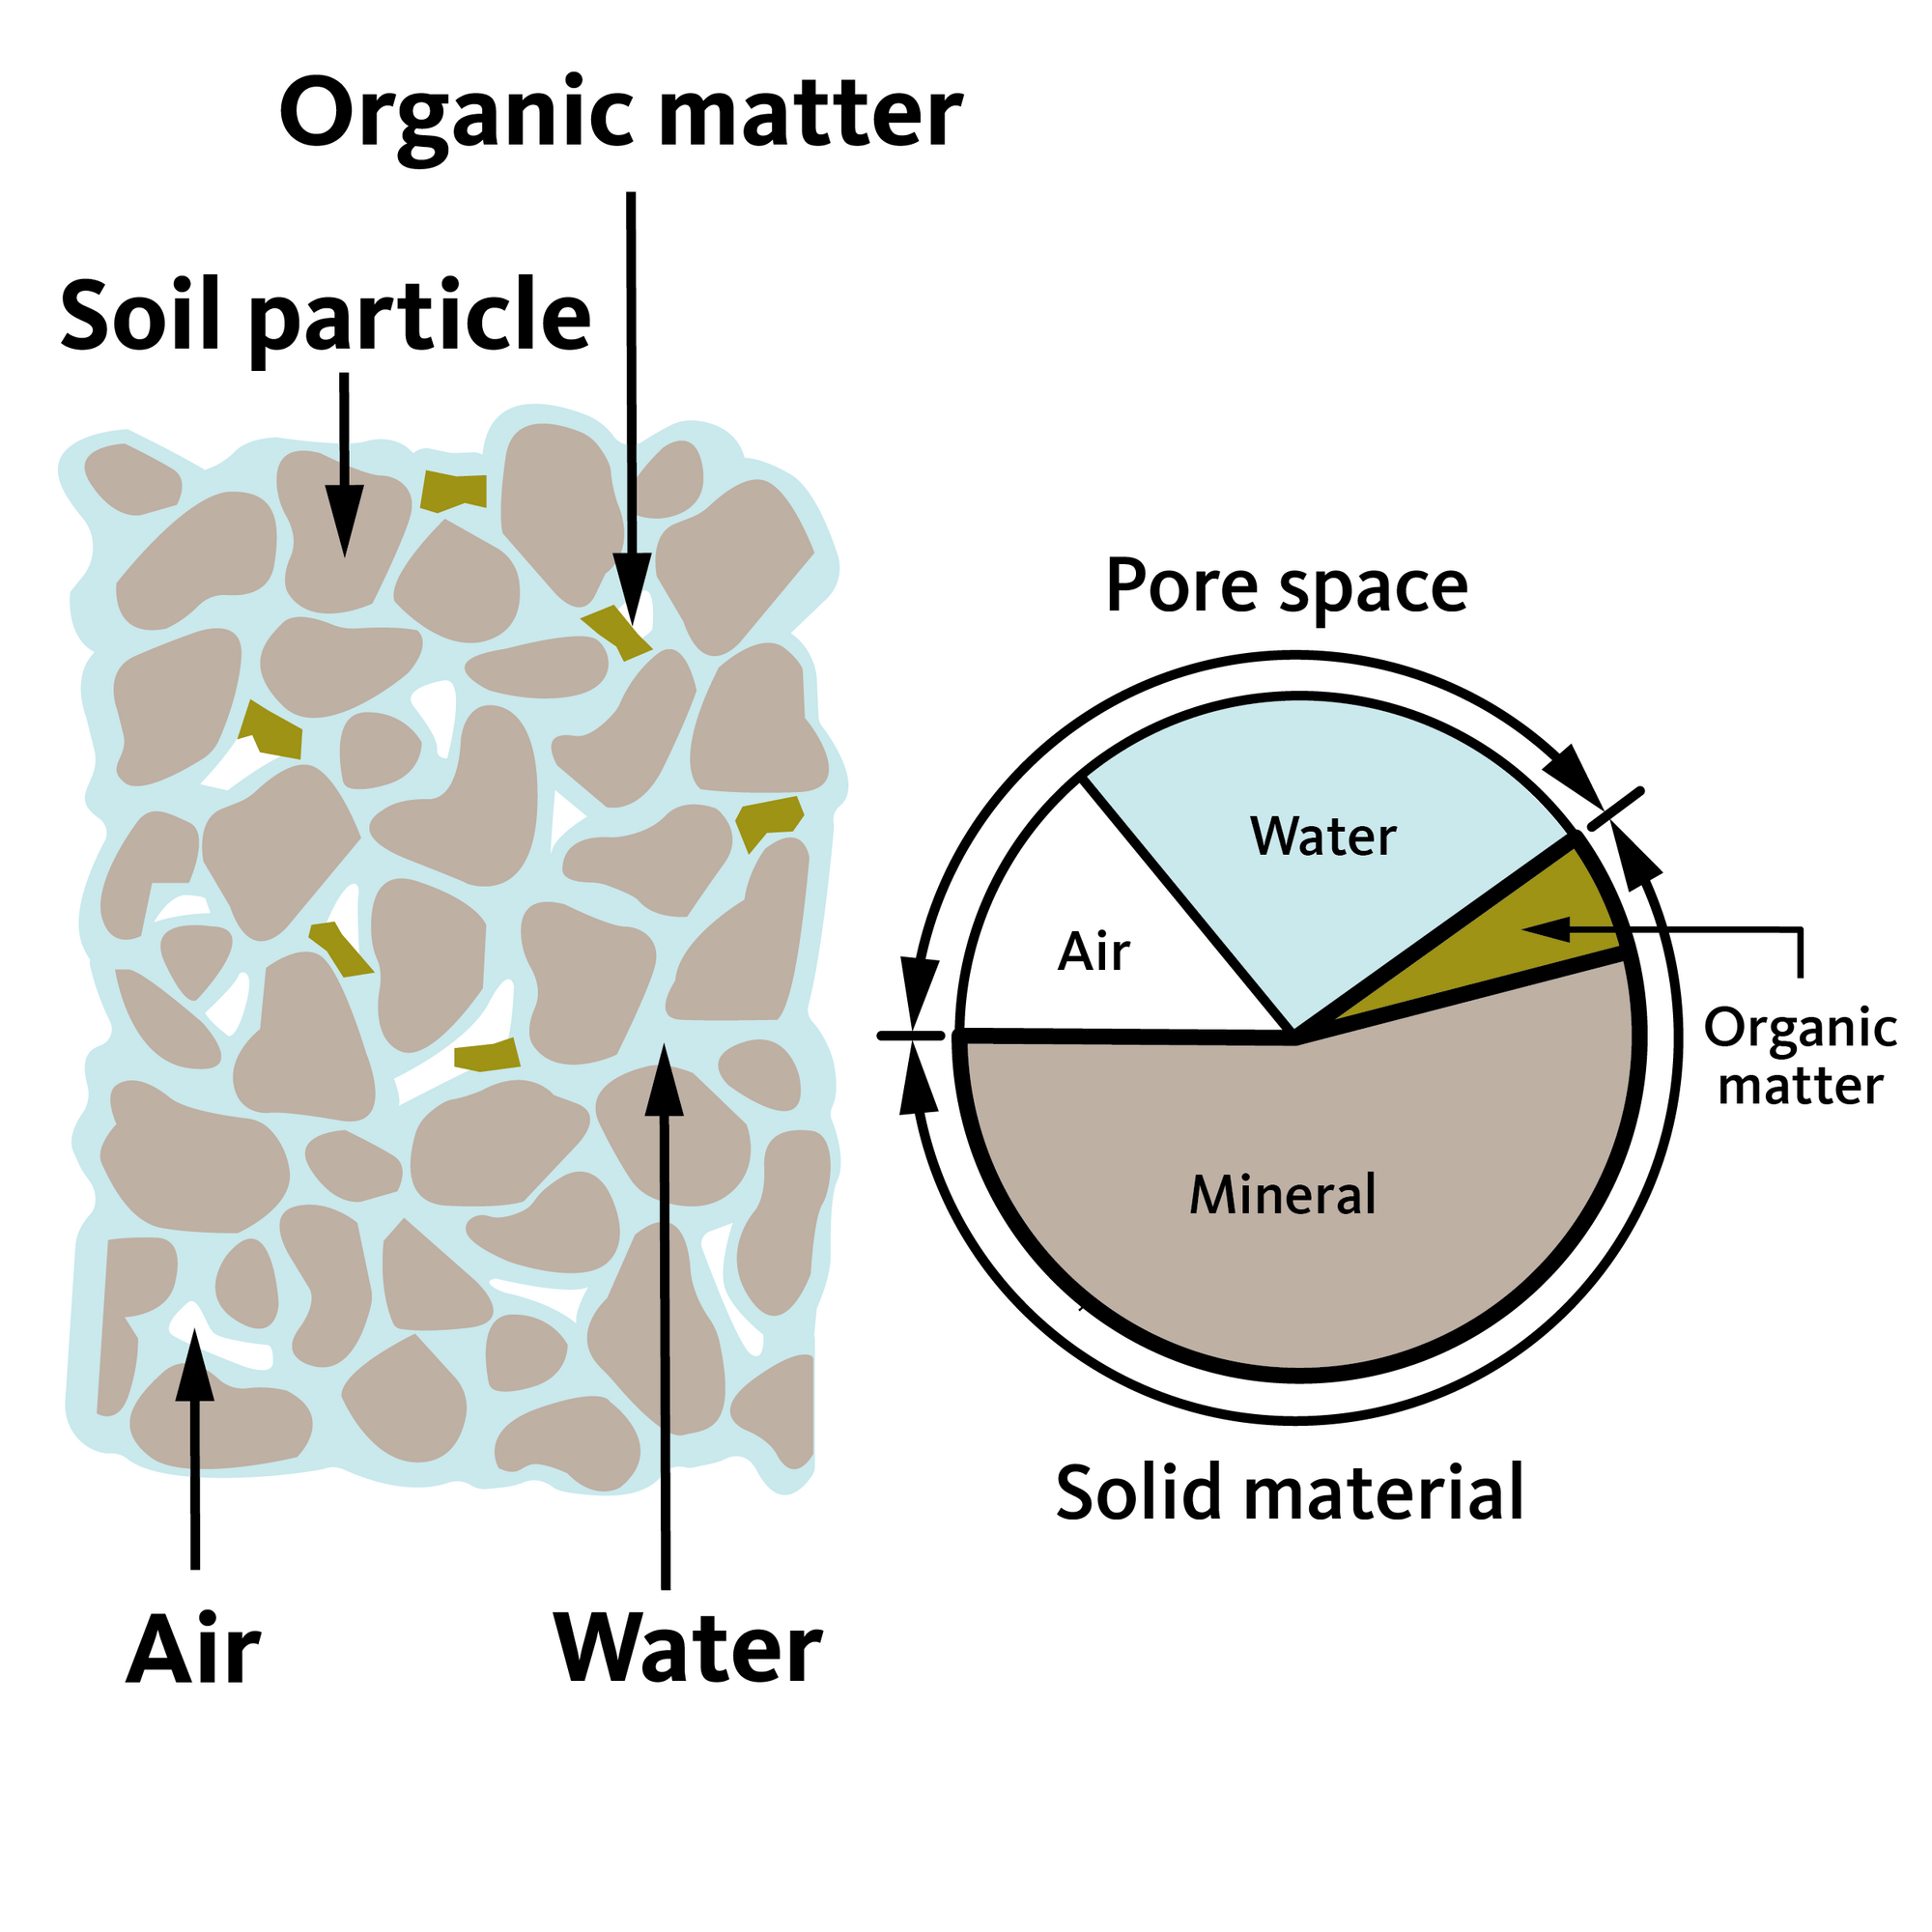
Soil moisture refers to the water stored within the pore spaces of unsaturated soil. It includes both liquid water and water vapor contained between soil particles. Unlike groundwater, which fills all pore spaces below the water table, soil moisture exists in the upper soil profile where air and water share the pore space.
The amount of soil moisture present depends on soil texture, structure, organic matter content, bulk density and soil depth. Weather conditions influence soil moisture through precipitation and evapotranspiration. Crop type and growth stage further affect soil water through varying rates of transpiration.
Soil moisture is typically monitored within the effective rooting depth of a crop to ensure sufficient water is available for optimal growth.
Why measure soil moisture?
Water moves through soils differently depending on soil texture, structure, organic matter content and pore-size distribution. Soil texture refers to the relative proportion of sand, silt and clay particles, which strongly influences how water is stored and transported through the soil profile.
Water occupies the pore spaces between soil particles. When all pore spaces are filled with water, the soil is saturated. At saturation, air is displaced from the soil pores, reducing oxygen availability to roots.
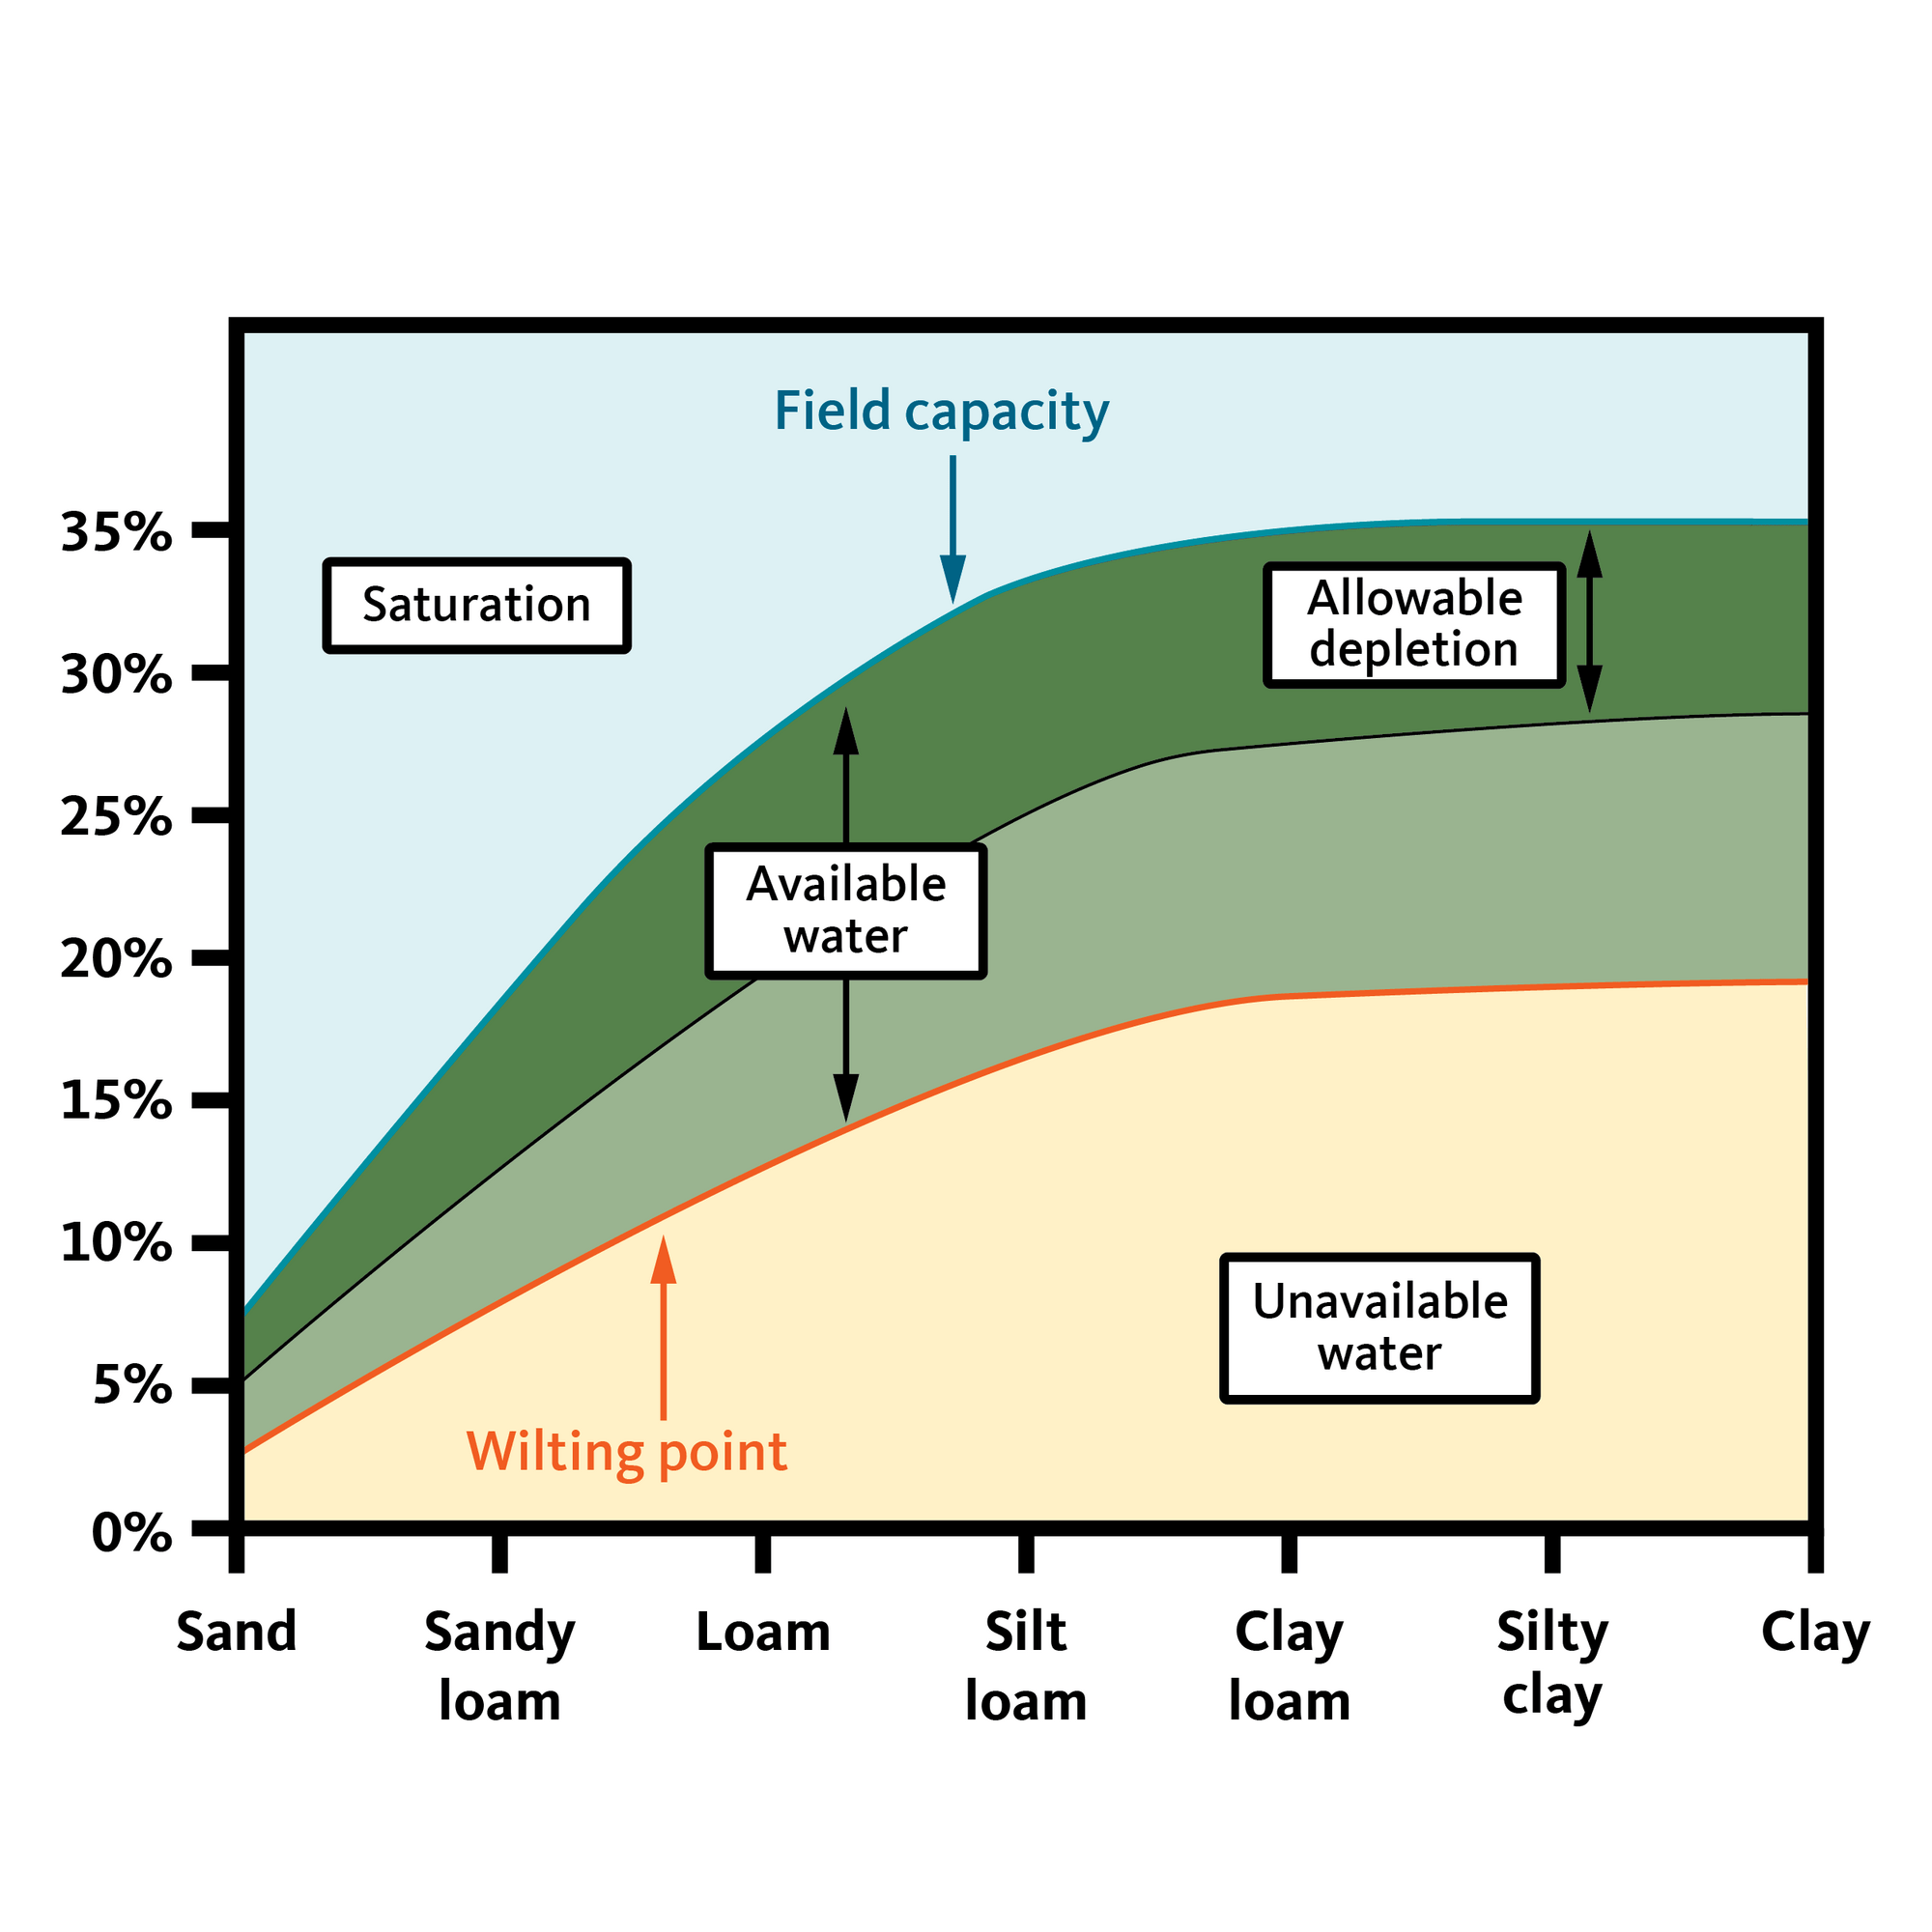
After saturation, gravitational water drains from the large soil pores until the soil reaches field capacity — a relatively stable water content at which downward drainage becomes minimal and capillary forces retain water against gravity. As plants use water through evapotranspiration, soil moisture decreases, and the soil matrix holds the remaining water more tightly. Eventually, soil moisture reaches the permanent wilting point, the level at which plants cannot extract sufficient water to recover from wilting.
The difference between field capacity and permanent wilting point is known as available water capacity — the portion of soil water that is generally accessible for plant uptake. Available water capacity varies with soil texture and structure (Figure 2).
Measuring soil moisture allows growers to determine:
- How much plant-available water remains in the root zone
- How quickly water is being depleted through ET
- When irrigation is needed to prevent crop stress
- Whether irrigation is reaching the intended root depth
Maintaining soil moisture within the range of plant-available water supports adequate water and nutrient uptake, enabling optimal crop growth while minimizing water loss through deep percolation or runoff. Soil moisture monitoring therefore provides a direct, field-based method to improve irrigation timing and water use efficiency.
Soil moisture content and soil moisture tension
Soil water can be described in two fundamentally different but complementary ways:
- Soil moisture content refers to how much water is present.
- Soil moisture tension (matric potential) refers to how tightly water is held in soil.
Both are important for irrigation management.
Soil moisture content
Soil moisture content describes the quantity of water stored in the soil. It can be expressed on either a mass or volume basis. You can determine soil moisture content by conducting gravimetric or volumetric testing, or through the use of sensors.
Gravimetric soil moisture content (θg)
Gravimetric water content is determined by measuring the mass of water in a soil sample relative to its dry mass:
θg = Mass of water/Mass of dry soil
Gravimetric water content (θg) is typically expressed in g g⁻¹ or percent by weight.
- Determined by soil sampling: Use an auger or shovel to collect a soil sample. Weigh the sample to determine its fresh weight. Oven-dry the soil at 105°C, then weigh it again. This is the dry weight. The loss in weight represents gravimetric water content (θg).
Volumetric soil moisture content (θv)
Volumetric water content is the volume of water per volume of soil:
θv = Volume of water/Total soil volume
Volumetric content (θv) is expressed as cm³/cm³, m³/m³, or percent by volume.
Volumetric water content is often more useful for irrigation scheduling because it directly relates to water depth in the root zone. For example, a volumetric water content of 0.25 cm³/cm³ in a 12-inch root zone corresponds to 3 inches of stored water.
- Determined by soil sampling: Collect a soil core of known volume using a sampler (ring or core method). Weigh the sample, dry it in an oven at 105°C to constant mass, and reweigh it to determine the mass of water. The volume of water is calculated from its mass (using the density of water).
- Calculated from gravimetric water content: Volumetric content (θv) may also be calculated from gravimetric content using soil bulk density: θv = θg×ρb
Where:
- θv = Volumetric water content
- ρb = soil bulk density
- θg = gravimetric content
Practical considerations
Gravimetric and volumetric methods are:
- Highly accurate
- Considered reference methods
- Used to calibrate soil moisture sensors
However, they are labor-intensive and not real-time, making them impractical for routine irrigation decisions in most commercial fields.
To find out more about how soil moisture content is determined, see Gravimetric Water Content from Virtual Soil Science Learning Resources.
Sensors that measure soil water content
Examples include:
- Dielectric soil moisture sensors (capacitance and TDR probes)
- Neutron moisture meters
Soil moisture tension (soil water potential)
Soil moisture tension, more accurately referred to as soil water matric potential, describes the energy required by plant roots to extract water from the soil. Unlike soil water content, which indicates how much water is present, matric potential describes how tightly that water is held.
Water is retained in the soil primarily due to:
- Adhesion (attraction between water and soil particles)
- Cohesion (attraction between water molecules)
- Capillary forces within soil pores
As soil dries, the largest pores drain first. Water remains in progressively smaller pores, water films surrounding particles become thinner, and the energy required to remove water increases. Therefore, the drier the soil, the greater the force roots must exert to extract water.
Units of soil water tension
Soil water potential is expressed as a negative pressure relative to atmospheric pressure and is commonly expressed as:
- Kilopascals (kPa)
- Bars
- Centibars (cb)
(1 bar = 100 centibars ≈ 100 kPa)
Typical soil water tension values
- Saturation ≈ 0 kPa
- Field capacity ≈ −10 to −33 kPa (texture-dependent)
- Permanent wilting point ≈ −1500 kPa
Sensors that measure soil water tension
The following sensors measure matric potential (tension), not water content:
- Tensiometers
- Electrical resistance blocks
- Granular matrix sensors
Measuring soil moisture
You can use several methods to measure and monitor soil moisture. These methods fall into two primary categories:
- Soil water content methods, which measure the amount of water in the soil.
- Soil water tension (matric potential) methods, which measure how tightly water is held in the soil and how much energy plants must use to extract it.
These methods quantify how much water is stored in the root zone and are useful for determining how much water has been depleted and how much irrigation is needed to refill the soil profile.
Soil moisture sampling: Feel and appearance method
Estimating soil moisture by feel and appearance is a simple, low-cost field method for assessing soil water status within the crop root zone. This method involves collecting soil from different depths using a soil probe, auger or shovel and evaluating its texture, color, cohesiveness and ability to form a ball or ribbon.
Because soil behavior changes with texture and water content, interpretation varies for sandy, loamy and clay soils. For example:
- Sandy soils feel loose and crumbly when dry and will not hold together well even when moist.
- Loamy soils can form a weak ball when moist.
- Clay soils feel sticky when wet and form a strong ribbon.
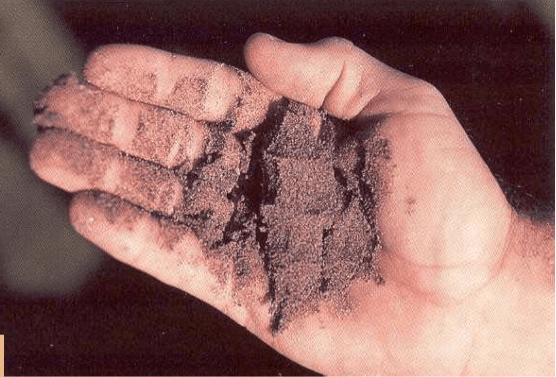
With training and experience, the feel and appearance method can estimate volumetric soil moisture within approximately 5%–10%, depending on soil texture and operator skill.
Evaluate soil in 1-foot increments down to the effective rooting depth of the crop to determine where moisture is being depleted and where irrigation water is penetrating.
Although this method does not provide real-time quantitative data, it is an excellent tool for:
- Validating soil moisture sensor readings
- Verifying irrigation depth and uniformity
- Developing intuition about soil water behavior
For more information and soil texture comparison tables, see Estimating Soil Moisture by Feel and Appearance, USDA Natural Resources Conservation Service.
Tensiometers
Tensiometers are soil moisture sensors used to measure soil water tension (matric potential). Producers in horticultural, vegetable and specialty crop systems commonly use tensiometers where irrigation is frequent and soils are monitored closely.
How they work
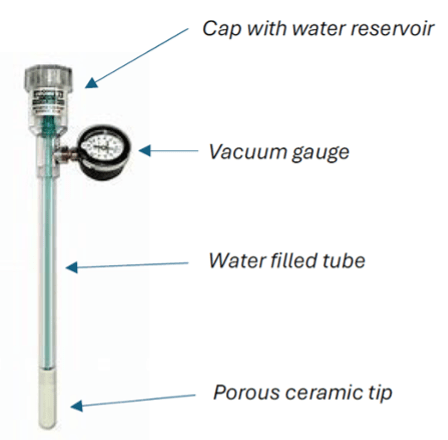
A tensiometer (Figure 4) consists of:
- A water-filled tube approximately 1 inch in diameter
- A vacuum gauge, at the upper end
- A porous ceramic cup, at the lower end
The ceramic tip is installed at the desired depth within the root zone. Water moves through the porous tip in response to changes in soil water conditions. As the surrounding soil dries, water is drawn from the tensiometer through the ceramic cup, creating a measurable vacuum inside the tube. This vacuum reflects the soil water tension.
Tensiometers read in centibars (cbar) or kilopascals (kPa).
(1 cbar ≈ 1 kPa)
Advantages, limitations and considerations
- The typical measurement range is 0 to approximately 70–85 cb. Beyond this range, air may enter the water column (a process known as cavitation), breaking hydraulic continuity and causing inaccurate readings.
- Because fine-textured soils often exceed this tension range before reaching irrigation thresholds, tensiometers may not fully capture the dry end of the available water range in clay soils.
- Tensiometers are relatively easy to install, read and maintain, but they must remain properly filled with water and free of air bubbles to function accurately.
- Interpreting tensiometer readings requires knowledge of soil texture and, ideally, a soil water characteristic curve to relate tension values to soil water content.
For additional guidance on installation and operation, see Tensiometers: Installation and Operation.
|
Soil type |
Saturated soils (cbars) |
Field capacity (cbars) |
Typical irrigation threshold (cbars) |
cbars) |
|---|---|---|---|---|
|
Loamy sand/sandy loam |
0–10 | 10–15 | 20–30 | 45–60 |
|
Loam/silt loam |
0–10 | 20–30 | 30–50 | 50–70 |
|
Clay loam/clay |
0–10 | 30–40 | 50–60 | 60–100 |
1 centibar (cbar) ≈ 1 kilopascal (kPa)
Credit: Adapted from Irrometer
Note: These values are approximate and may vary depending on crop type, rooting depth and management strategy. High-value or shallow-rooted crops are often irrigated at lower tension values, while deeper-rooted crops may tolerate higher tension before irrigation is required.
Electrical resistance block and granular matrix and sensors
Electrical resistance blocks, commonly known as gypsum blocks or soil moisture blocks, measure soil water tension (matric potential) indirectly by monitoring changes in electrical resistance within a porous medium.
How they work
These sensors contain two embedded electrodes surrounded by a porous material (typically gypsum or a granular matrix) (Figure 5). The block is installed in the soil at the desired monitoring depth.
As soil moisture changes, water moves into or out of the porous material until it equilibrates with the surrounding soil. Because electrical conductivity increases with moisture content:
- When the block is wet, electrical resistance is low.
- As the soil dries, resistance increases.
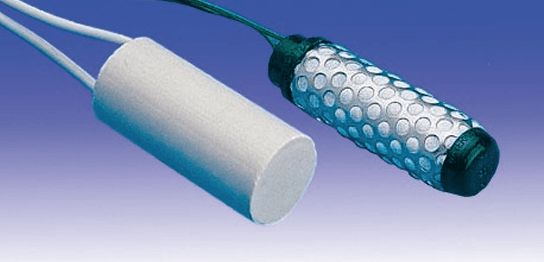
The resistance measurement is converted — using manufacturer calibration tables or electronic meters — into soil water tension values (usually reported in centibars or kilopascals).
Gypsum blocks
Traditional gypsum electrical resistance blocks are relatively inexpensive and easy to install and read. However, they have limitations:
- They gradually dissolve in wet soils.
- They are influenced by soil salinity.
- Long-term stability may decline over time.
Because salts increase electrical conductivity, highly saline soils can cause inaccurate readings.
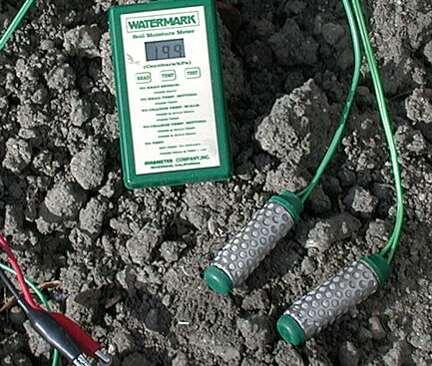
Granular matrix sensors
Granular matrix sensors were developed to improve durability and reduce sensitivity to salinity. These devices typically consist of:
- A porous ceramic outer shell
- A granular internal matrix surrounding the electrodes
The matrix buffers salinity effects and improves long-term structural stability compared to gypsum blocks.
Granular matrix sensors measure soil water tension over a wider operating range than tensiometers and can function at drier conditions where tensiometers cavitate.
Readings can be collected with:
- Handheld meters
- Data loggers
- Automated irrigation controllers
Advantages
- Relatively inexpensive
- Moderate measurement range (approx. 0–200 kPa, depending on model)
- Compatible with automation
Limitations
- Require soil contact for accuracy.
- May require periodic recalibration.
- Less precise than laboratory methods.
- Temperature effects can influence resistance readings.
For more information on how to prepare and read granular matrix sensors, see Watermark Soil Moisture Sensor — How to Install and Soil Sensors and ET Gauges.
Dielectric soil sensors
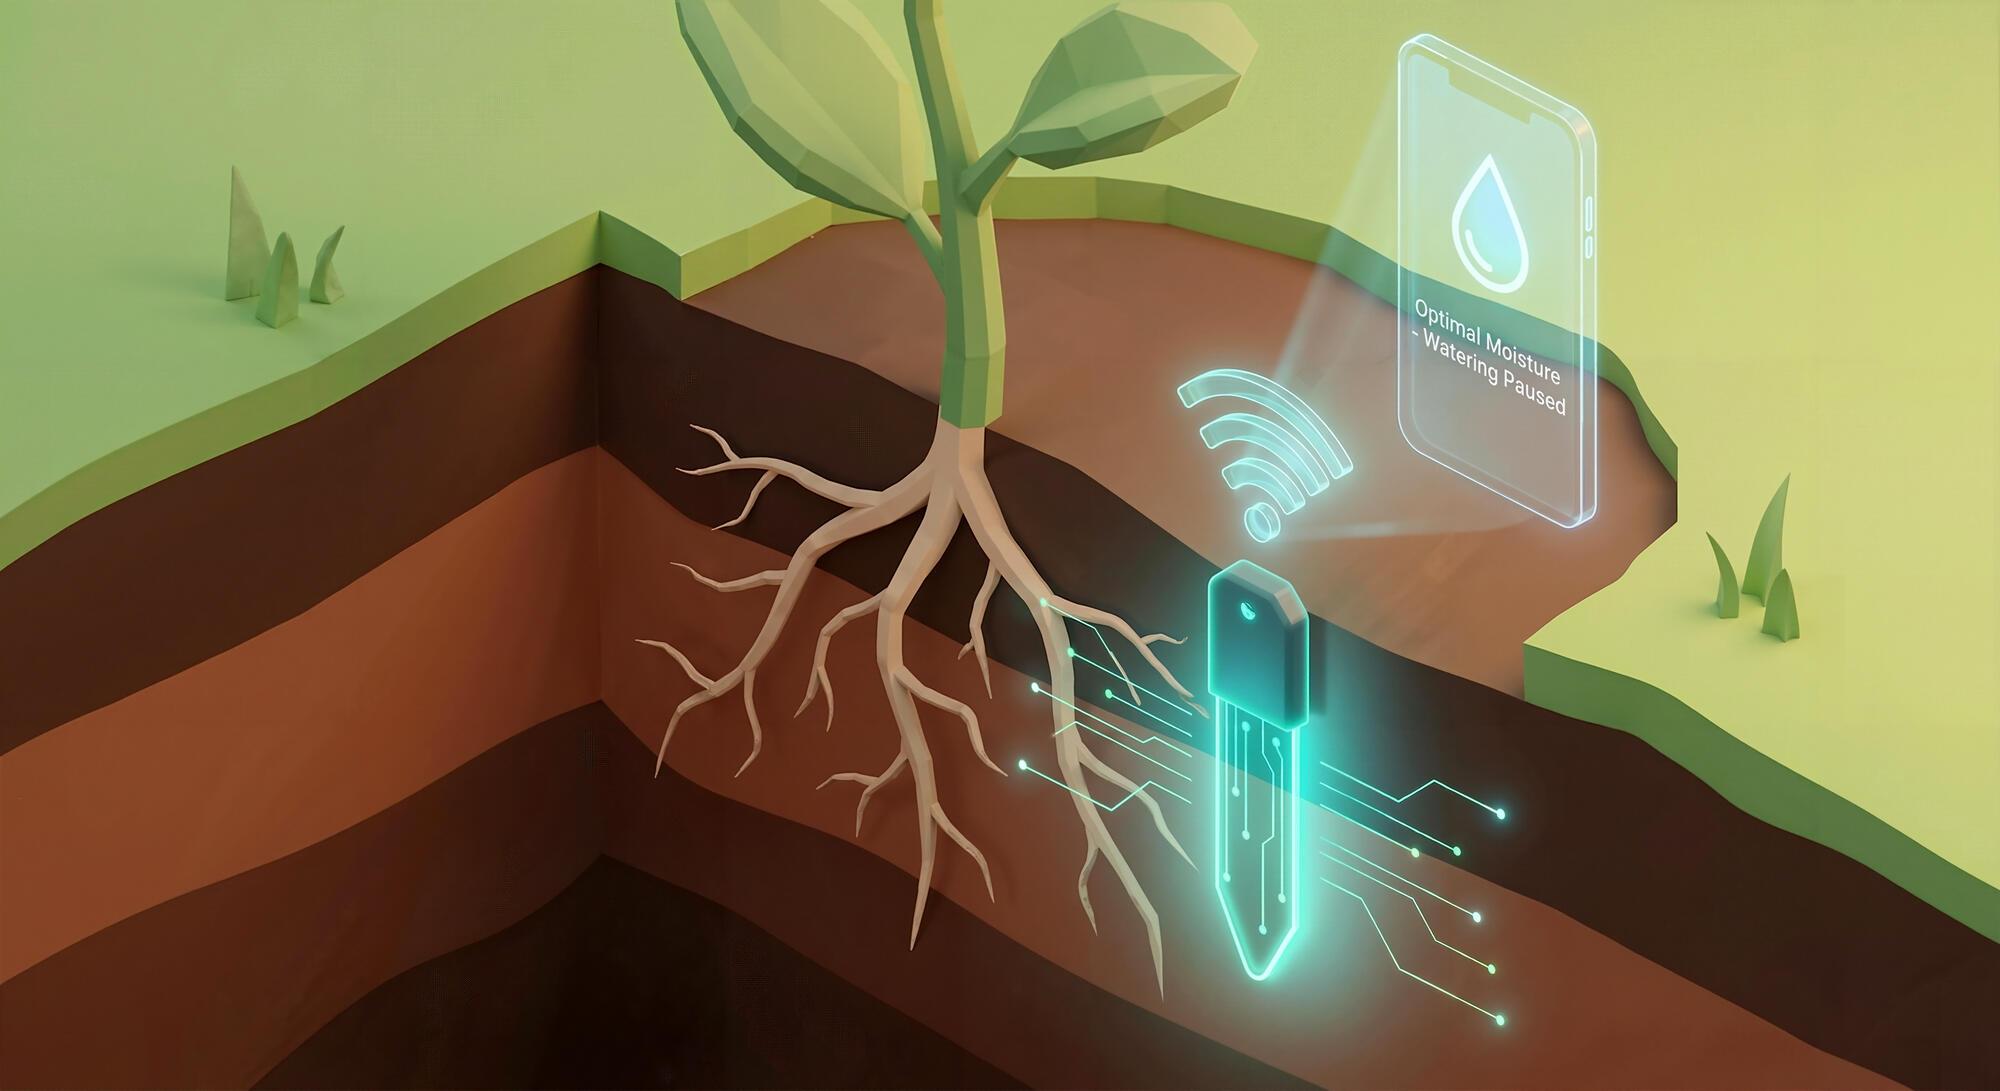
Dielectric soil sensors, also called electromagnetic soil moisture sensors, measure volumetric soil water content by estimating the soil’s dielectric permittivity (dielectric constant).
Water has a much higher dielectric constant (~80) than soil minerals (3–5) or air (~1). As soil water content increases, the bulk dielectric constant of the soil increases. Electromagnetic sensors measure this property and convert it to volumetric water content using calibration equations.
Unlike tension-based sensors, dielectric sensors directly estimate the quantity of water present, rather than how tightly it is held.
These sensors are widely adopted because they:
- Provide near-instantaneous readings
- Can be integrated into automated data logging systems
- Require less maintenance than water-filled sensors such as tensiometers
However, dielectric soil sensors require proper installation and calibration to ensure accurate readings.
Time-domain reflectometry
Time-domain reflectometry determines soil water content by measuring the travel time of an electromagnetic pulse through the soil.
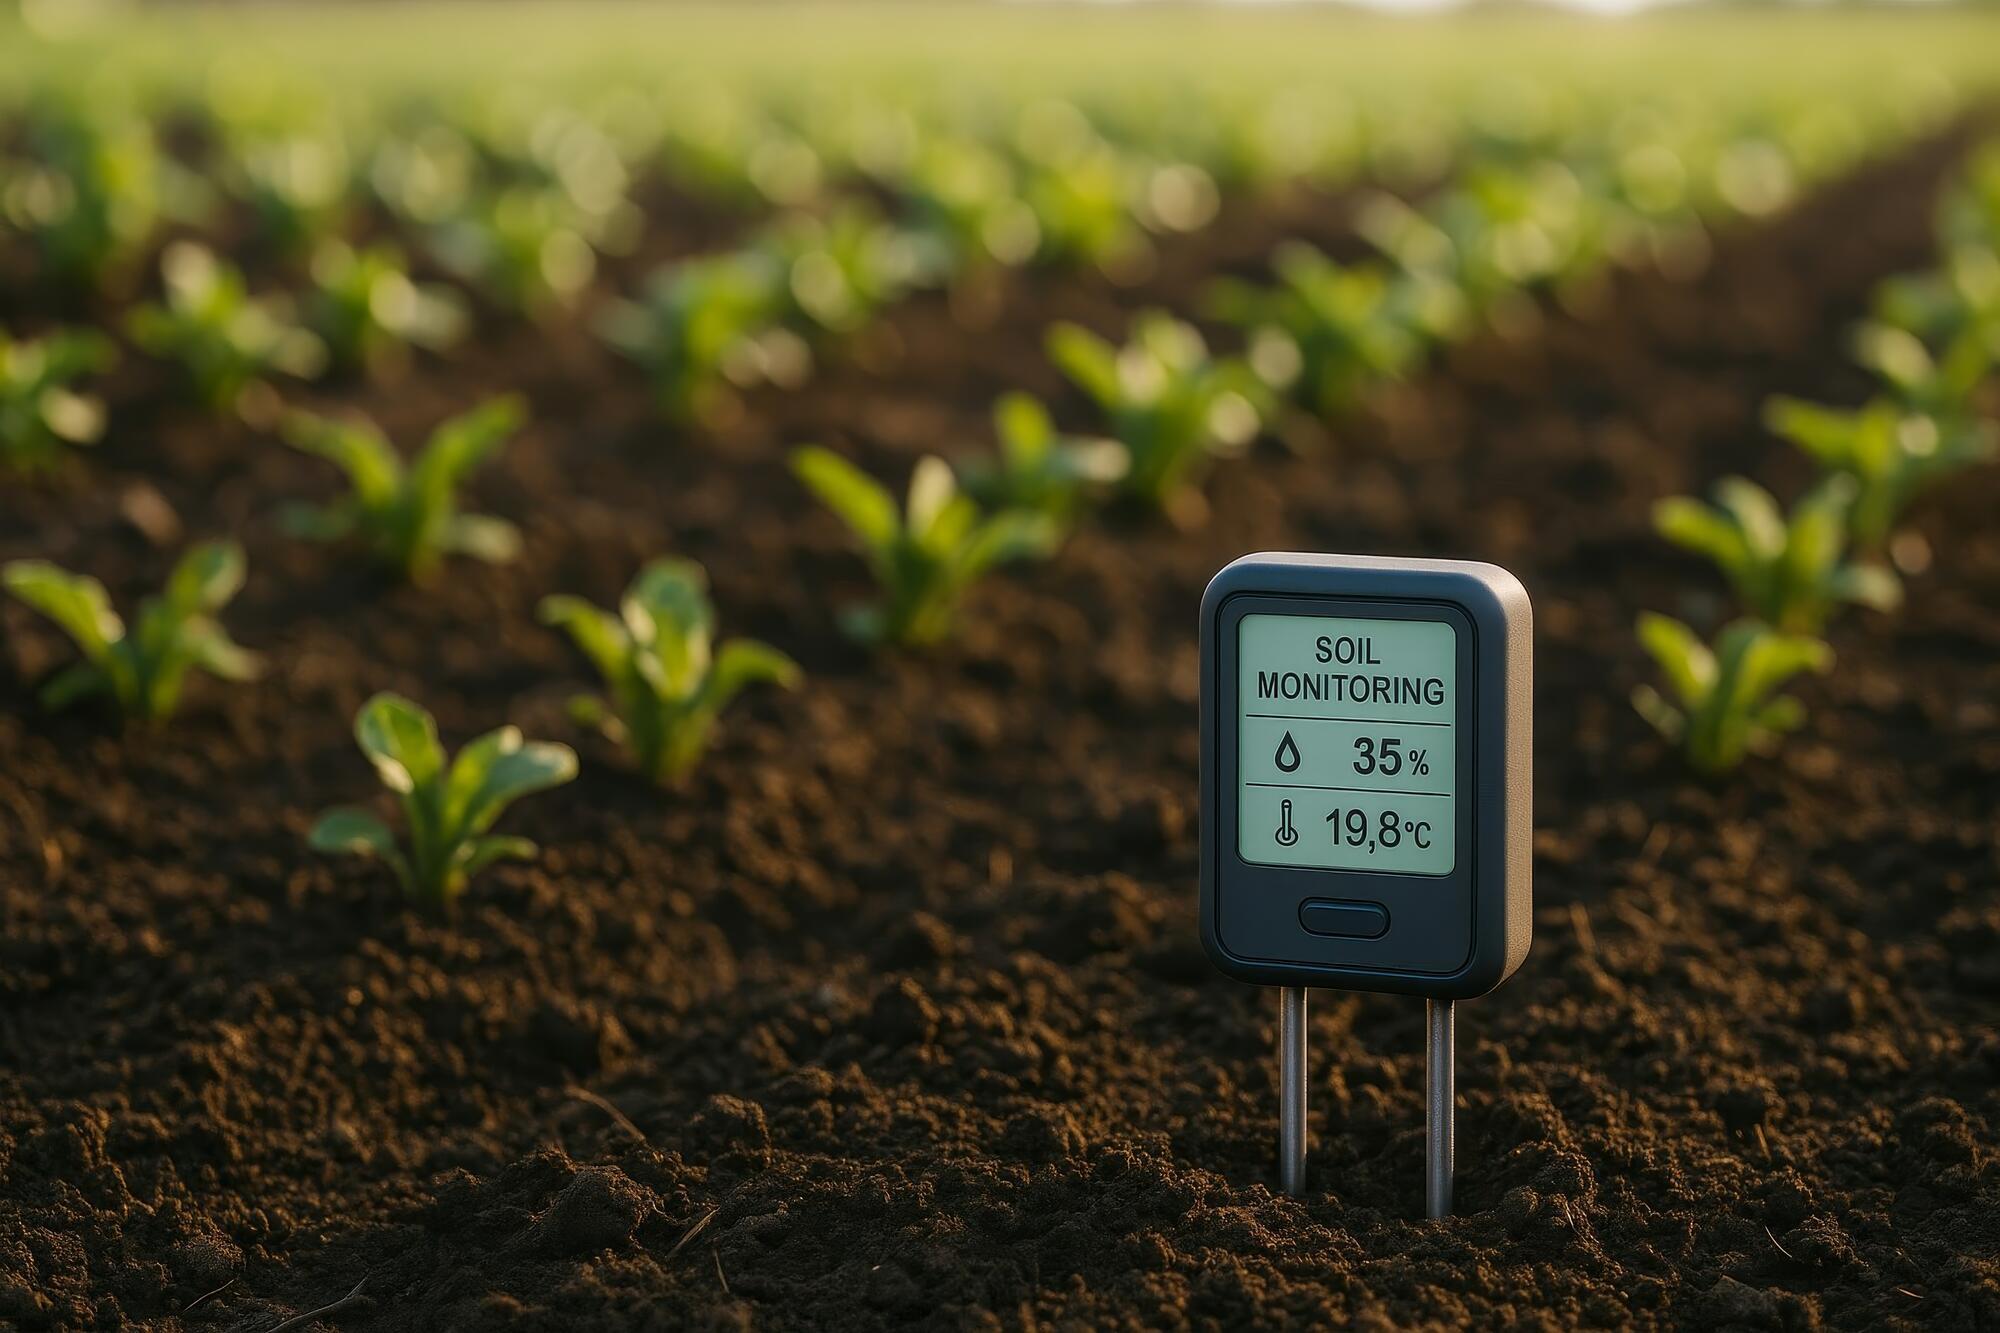
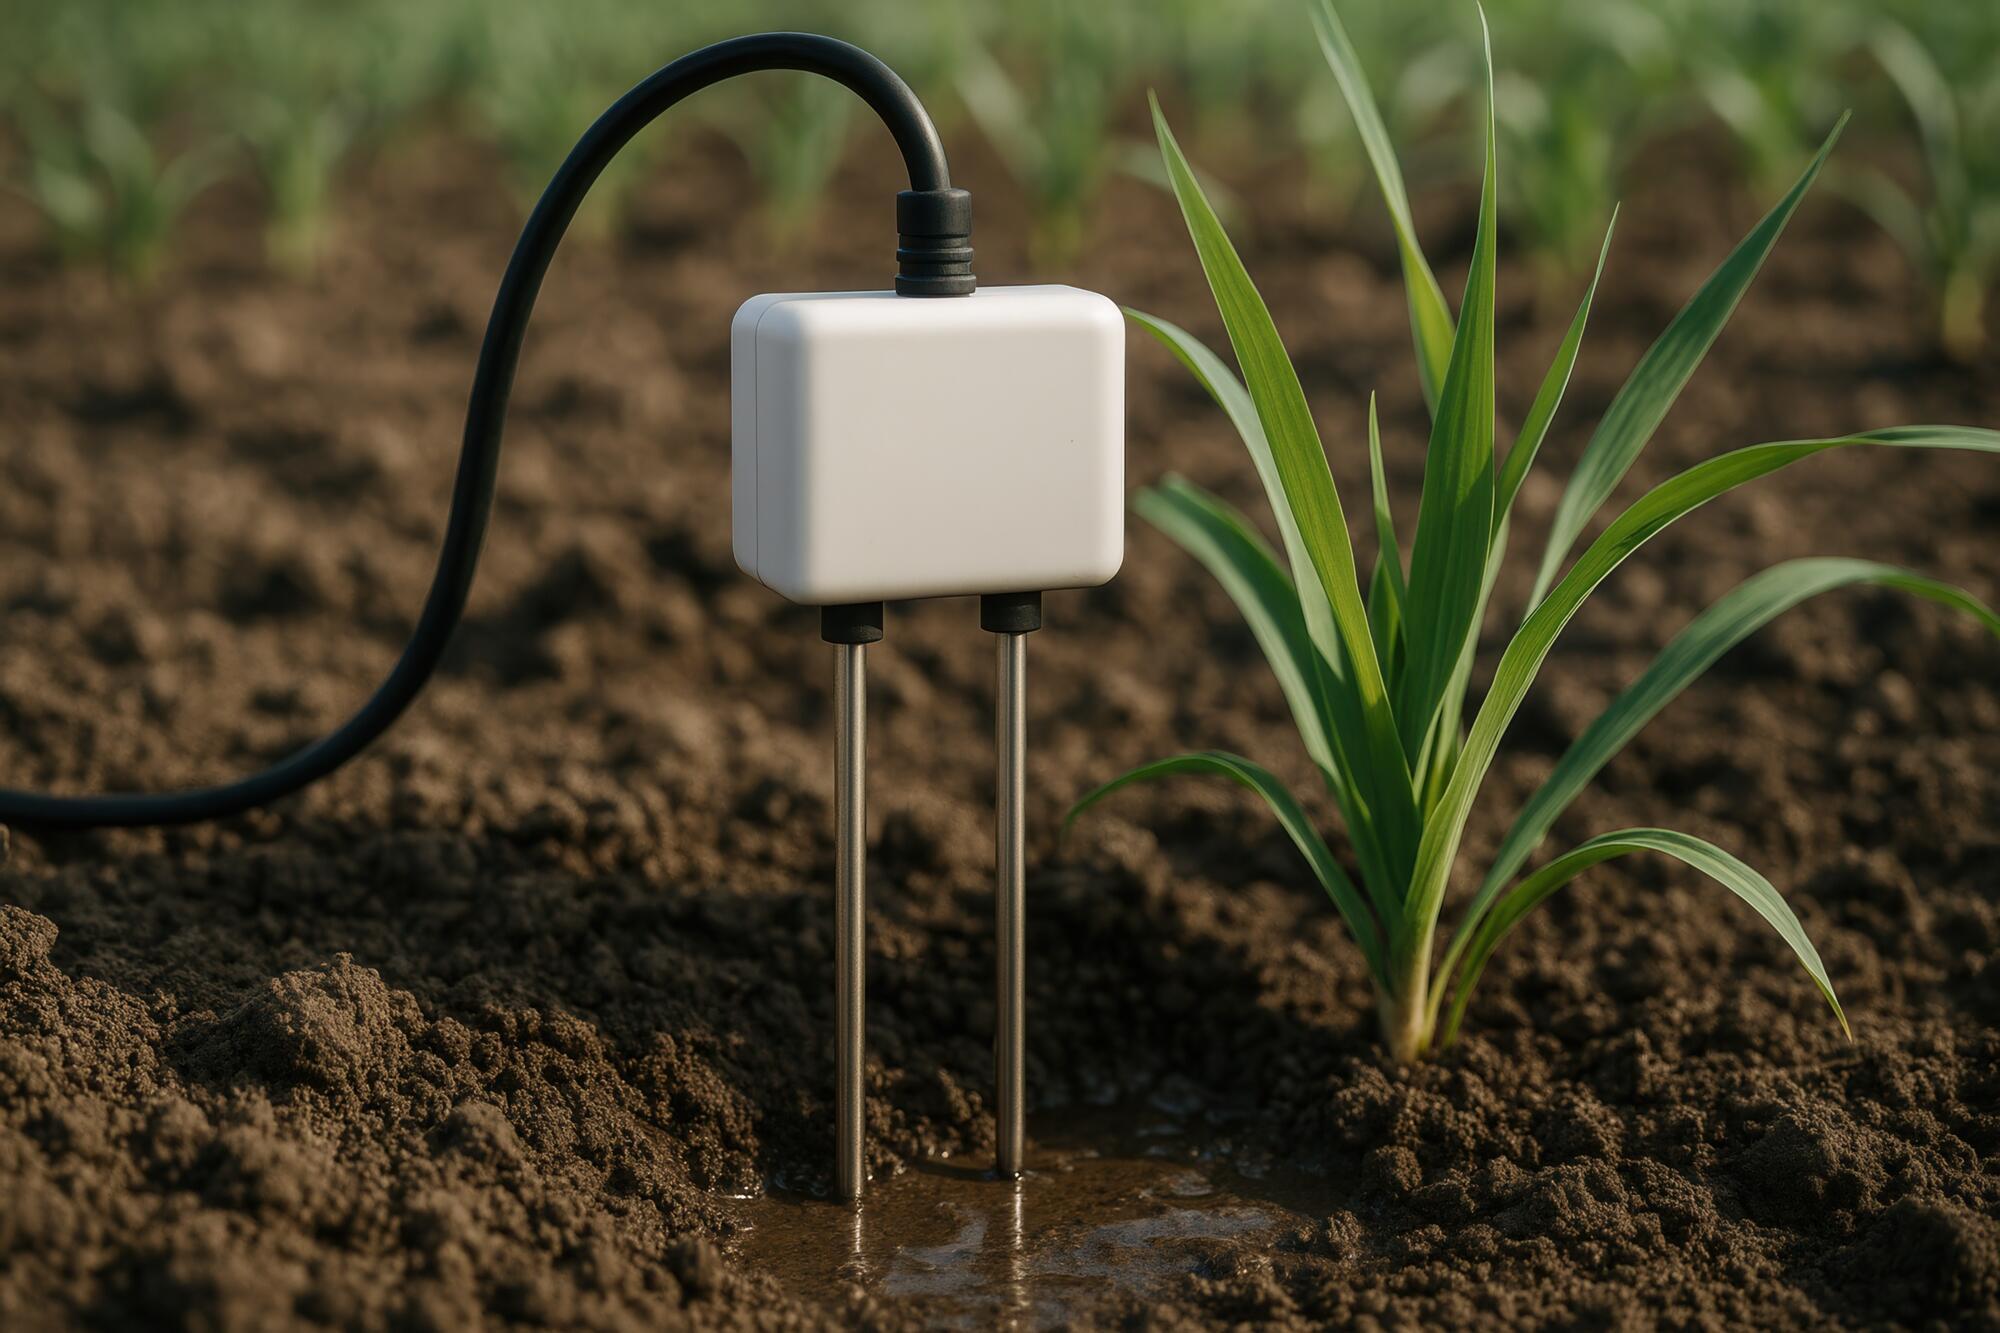
A TDR sensor consists of two or three parallel stainless steel rods (waveguides) inserted into the soil (Figure 7A-B). The instrument sends a high-frequency electromagnetic pulse along the rods. TDRs measure the time required for the pulse to travel through the soil and reflect back to the sensor.
Because electromagnetic waves travel more slowly in wetter soils (due to higher dielectric permittivity), travel time increases as soil water content increases.
TDR sensors are:
- Generally very accurate (±2%–3% volumetric water content under proper calibration)
- Less sensitive to salinity compared to capacitance sensors
- Available in probe lengths ranging from several inches to several feet
Calibration may be soil-specific, especially for soils high in clay or organic matter.
To find out more about how these sensors are installed, see Soil Moisture Sensor Installation and Soil Water Content.
Frequency-domain reflectometry/capacitance sensors
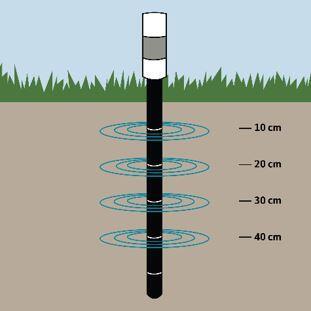
Frequency-domain reflectometry, often referred to as capacitance sensors, estimate volumetric water content by measuring changes in the resonant frequency of an oscillating electrical circuit (Figures 8A, 8B).
These sensors contain:
- Two or more electrodes
- An oscillating circuit
The electrodes use the soil as part of the capacitor’s dielectric medium. When inserted into the soil, the sensor applies an oscillating electromagnetic signal (typically 50–150 MHz). As soil moisture increases, dielectric permittivity increases, altering the resonant frequency of the circuit.
In general:
- Soil moisture affects the dielectric permittivity of the soil, which changes the resonant frequency measured by the sensor.
- In most capacitance sensors, higher soil moisture results in lower resonant frequency, while drier soil results in higher resonant frequency.
The exact frequency response depends on sensor design and calibration.
Advantages
- Typically, lower cost than TDR sensors
- Compatible with telemetry and automated irrigation systems
- Available in multi-depth or profile probe configurations
- Provide near real-time measurements
Limitations
- More sensitive to salinity and temperature effects
- Sensitive to air gaps around the probe
- Accuracy depends on proper soil contact and installation
Calibration is recommended for improved accuracy in different soil textures, especially in high-clay, saline or high-organic-matter soils.
Neutron moisture meters
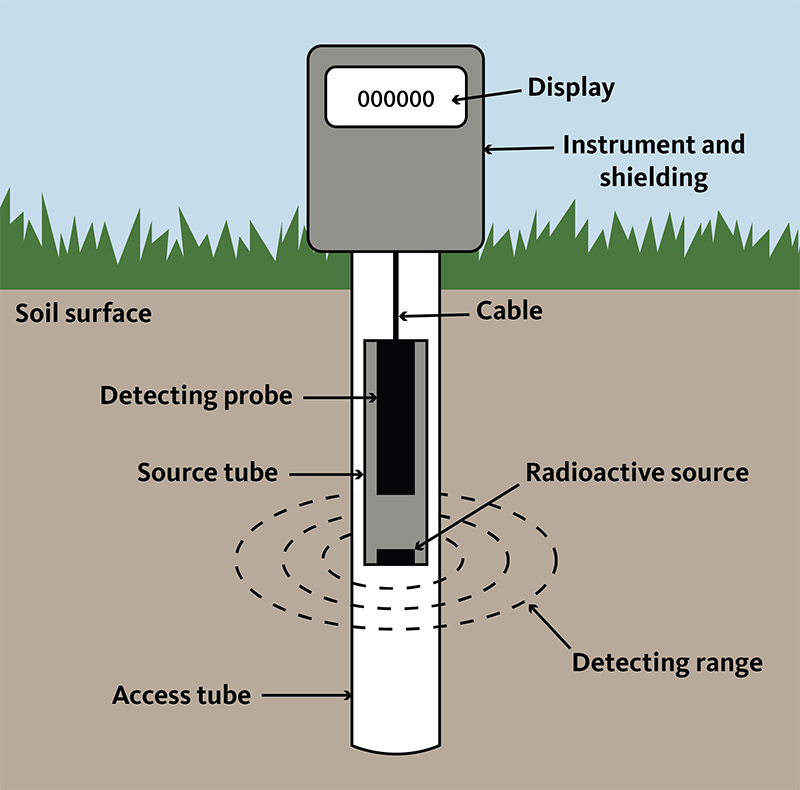
Neutron moisture meters, also known as neutron probes or neutron scattering devices, estimate volumetric soil water content using radioactive neutron sources (Figure 9).
A neutron probe consists of:
- A sealed radioactive neutron source
- A detector
- An electronic gauge
- A surface readout connected by cable
An aluminum or PVC access tube is installed vertically in the soil profile. During measurement, the neutron source is lowered to a specific depth inside the access tube.
The radioactive source emits high-energy (fast) neutrons into the surrounding soil. These neutrons collide with hydrogen atoms, primarily found in soil water. When fast neutrons collide with hydrogen nuclei, they lose energy and become slow (thermalized) neutrons.
The detector counts the number of slowed neutrons returning to the probe. Because hydrogen concentration is directly related to soil water content, neutron counts are proportional to volumetric water content.
Readings are converted to volumetric soil moisture using soil-specific calibration equations.
Neutron moisture meters are commonly used for research and to calibrate other soil moisture sensors.
Advantages
- High accuracy
- Excellent depth control
- Reliable for research applications
- Effective in deep soil profiles
Limitations
- Requires special licensing and regulatory compliance due to radioactive material
- Requires operator training and radiation safety protocols
- Relatively expensive
- Not practical for routine on-farm irrigation monitoring
For these reasons, neutron probes are primarily used in research settings and for calibrating other soil moisture sensors.
For more on installation protocols when using the neutron probe, see How to Measure Soil Moisture by Using a Neutron Probe.
Advantages and disadvantages of soil monitoring methods
|
Soil moisture monitoring technique |
Advantages |
Disadvantages |
Cost |
|---|---|---|---|
|
Feel and appearance |
|
|
Labor |
|
Gravimetric |
|
|
Labor, oven, scale |
|
Tensiometer |
|
|
$60–$80 (requires 3–4 sensors) plus $140-$160 if installed with transducer |
|
Electrical resistance block/granular matrix |
|
|
$20–$40 per sensor (requires 3–4 sensors per location) plus $200 for hand manual reader and $500 for data logger |
|
Time domain reflectometry |
|
|
$250–$350 per sensor plus $1,000–$3,500 for data logger |
|
Capacitance |
|
|
$250-$350 per sensor plus $500–$2,500 for data logger |
|
Neutron probe |
|
|
Approximately $10,000 and $25–$30 for access tubes |
Considerations when using soil moisture sensors
Proper installation, placement and interpretation of soil moisture sensors are critical to obtaining reliable and actionable data.
Define management zones first
Before installing sensors, divide the field into management zones based on relatively uniform characteristics such as:
- Soil texture and depth
- Topography and slope position
- Irrigation system type and uniformity
- Historical yield maps or crop vigor patterns
Each management zone should represent an area where soil water behavior is expected to be similar.
The USDA Web Soil Survey and the University of California, Davis, California Soil Labs can help you identify soil variability within fields. Install sensors in representative areas of the field with average soil and surface conditions. Avoid field edges, wheel tracks, ponded areas, or unusually wet or dry spots.
Number of monitoring locations
- Install a minimum of two monitoring locations per management zone to capture variability.
- In relatively uniform fields (up to about 40 acres), two monitoring sites are often sufficient.
- Fields with higher spatial variability in soil texture, elevation or irrigation uniformity may require additional monitoring locations.
Sensor placement density should reflect field variability, not acreage alone.
Sensor depth placement
- Install sensors within the effective rooting depth of your crop.
- Monitor at least two to three soil depths to capture soil water distribution.
- For deep-rooted crops such as alfalfa, consider installing the sensors at 1-foot increments up to 3 feet.
- For shallow-rooted crops, two depths are typically sufficient.
- Multidepth monitoring allows detection of:
- Overirrigation (deep percolation)
- Shallow drying
- Root-zone depletion patterns
Installation best practices
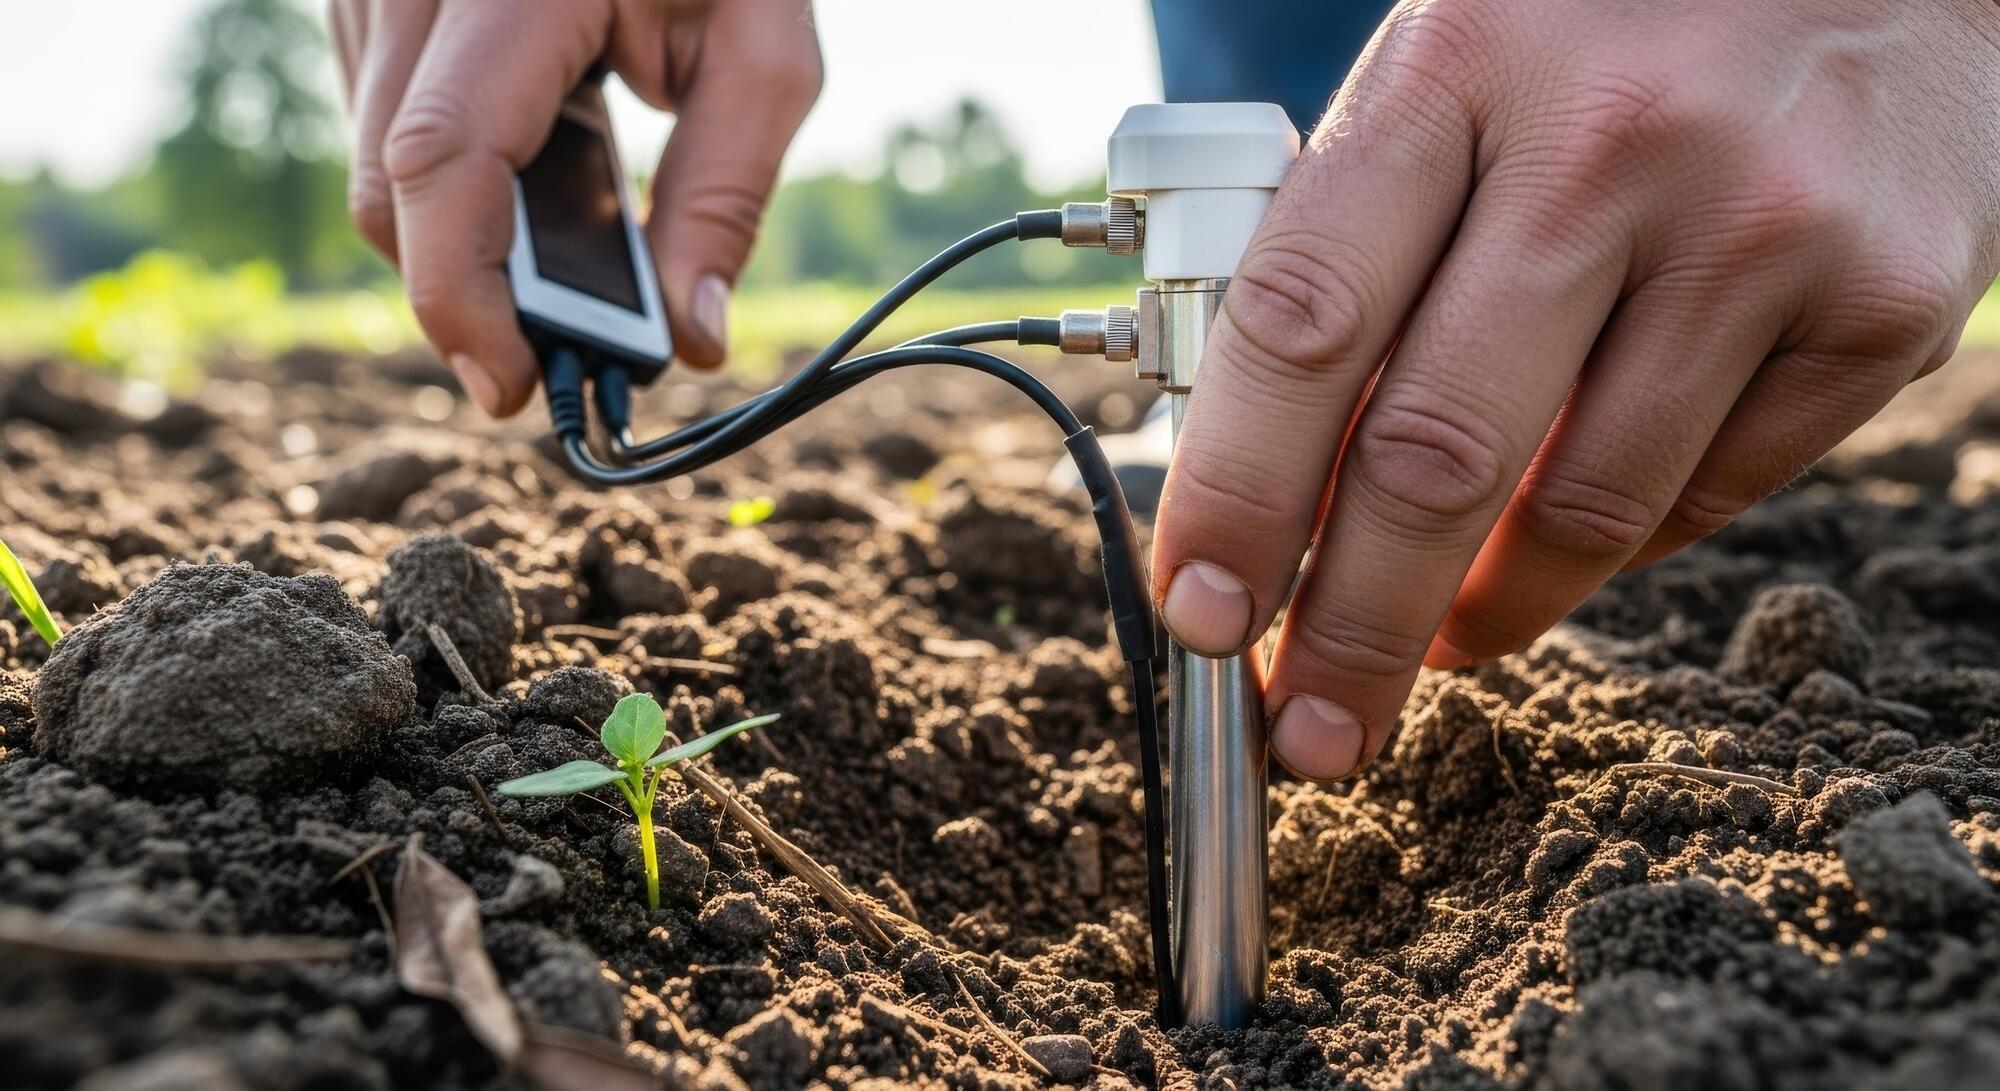
- Sensors should be carefully installed within the root zone, ensuring good soil contact.
- Avoid air pockets during installation; these can cause false sensor readings.
- Install sensors in undisturbed soil where possible.
- Protect and clearly mark sensor locations for easy identification in the field.
- Allow time for soil to settle around newly installed probes before relying on readings.
Interpretation and data
- Recognize that spatial variability in soil texture, structure, organic matter and salinity can influence readings.
- Keep detailed records of irrigation events, rainfall and crop condition.
- Correlate sensor readings with field observations (soil feel, plant stress indicators).
- Integrate soil moisture measurements with evapotranspiration estimates and other irrigation scheduling tools (for example, the irrigation checkbook method or computerized scheduling applications).
Developing confidence in sensor interpretation requires consistency and experience. Long-term monitoring improves decision accuracy.
Remote sensing and other soil moisture monitoring techniques
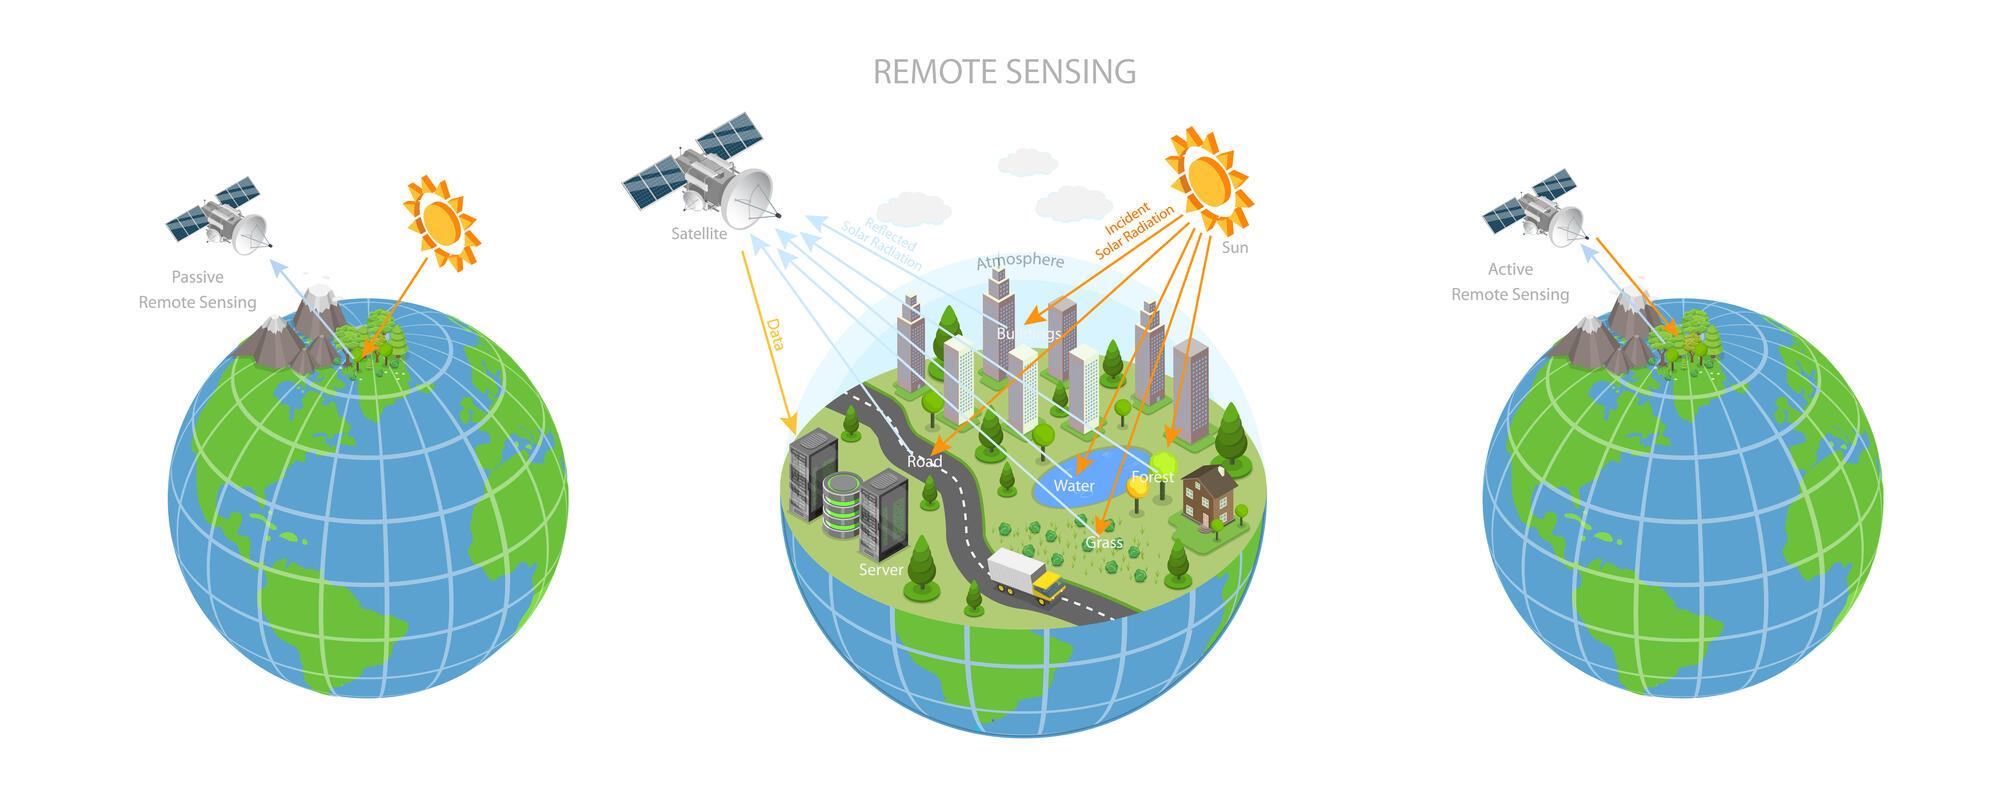
Remote sensing techniques estimate soil water content using satellite, aircraft (manned or unmanned) or proximal sensing platforms. A key advantage of remote sensing is its ability to provide spatial information over large geographic areas.
Satellite-based soil moisture products such as Soil Moisture Active Passive and Soil Moisture Ocean Salinity use microwave sensors to estimate surface soil moisture. These systems typically represent moisture conditions in the upper approximately 5–10 cm of soil. Because of this shallow measurement depth, they may not reflect moisture conditions throughout the full crop root zone.
Additionally, satellite soil moisture products often have coarse spatial resolution (several kilometers per pixel), which limits their usefulness for field-level irrigation scheduling but makes them well-suited for regional drought monitoring and large-scale water resource assessment.
Other emerging technologies include:
- Cosmic-ray neutron probes, which estimate area-integrated soil moisture across several hectares using neutron moderation by hydrogen in soil water.
- Center pivot–mounted microwave sensors, which estimate near-surface soil moisture during irrigation passes.
- Thermal and multispectral imagery, which can infer crop water stress through vegetation indices or canopy temperature.
Some systems integrate surface soil moisture measurements with weather data and soil water balance models to estimate root zone moisture through modeling approaches.
While remote sensing provides valuable spatial information, it is best used in combination with field-level soil moisture measurements when making irrigation management decisions.
References and resources
Doug, Y., S. Miller and L. Kelley. 2020. Performance Evaluation of Soil Moisture Sensors in Coarse- and Fine-Textured Michigan Agricultural Soils. East Lansing, MI: Michigan State University Extension, Michigan State University.
Hanson, B., S. Orloff and B. Sanden. 2007. Monitoring Soil Moisture for Irrigation Water Management. Davis, CA: University of California, Agricultural and Natural Resources.
Irrometer Co., Soil Water Basics. Riverside, CA.
Kramer, P.J. and J.S. Boyer. 1995. Water Relations of Plants and Soils. Academic Press, San Diego.
Meter Group, “Soil moisture sensors – How they work. Why some are not research grade.” Pullman, WA.
National Oceanic and Atmospheric Administration, National Integrated Drought Information System, Soil Moisture.
O’Connor, R., and M. White. 2017. Soil Moisture Monitoring. Victoria, Australia: The State of Victoria Department of Economic Development, Jobs, Transport and Resources.
Peters, R.T., K. Desta and L. Nelson. 2013. Practical Use of Soil Moisture Sensors for Irrigation Scheduling. FS083E, Pullman, WA: Washington State University Extension.
Sharma, V. 2018. Methods and Techniques For Soil Moisture Monitoring. B-1331. Laramie, WY: University of Wyoming Dept. of Plant Sciences.
Shock, C., F. X. Wang, R. Flock, E. Feibert and A. Pereira. 2013. Irrigation Monitoring Using Soil Water Tension. EM 8900. Corvallis, OR: Oregon State University.
USDA Natural Resources Conservation Service. 1998. Estimating Soil Moisture By Feel and Appearance. Program aid No. 1619.
University of Minnesota Extension. Irrigation strategies for vegetables.
Werner, H. 2002. Measuring Soil Moisture for Irrigation Water Management. FS876, Brookings, SD: South Dakota State University Cooperative Extension Service.
Acknowledgments
This material is based upon work that is supported by the National Institute of Food and Agriculture, U.S. Department of Agriculture, under award No. 2021-38640-34695 through the Western Sustainable Agriculture Research and Education program under project number WPDP22-020. USDA is an equal opportunity employer and service provider. Any opinions, findings, conclusions or recommendations expressed in this publication are those of the authors and do not necessarily reflect the view of the U.S. Department of Agriculture.
Gordon Jones (Oregon State University) contributed to this report. Reviewers included Matthew Alongi, NRCS State Irrigation Engineer; Mylen Bohle, Associate Professor, Emeritus; Troy Peters, Professor and Extension Irrigation Engineer, Irrigated Agriculture Research and Extension Center, Washington State University; Rex Barber of Big Falls Ranch, Terrebonne, Oregon; Mike Macy of Macy Farms, Culver, Oregon; Patrice Spyrka of Tumalo Alpen Ranch, Tumalo, Oregon; Greg Mohnen of Triple S Ranch; and Darrell Abby of Rock Island Ranch.
About the authors


